Showing posts sorted by relevance for query fossils. Sort by date Show all posts

Monday, April 23, 2018

A (wal)nut to crack – what a network tells you that no tree can


In this post, I will show a network that I generated some time ago as illustration of a point: morphological data should not be used to infer trees, but networks, instead — especially when the goal is to place some fossils in a modern-day phylogenetic framework.

In 2007, Manos et al. (Systematic Biology 56:412–430) published an interesting phylogenetic study that provided a phylogenetic framework to place some enigmatic fossils of the Juglandaceae, the walnut family. Following my preferred procedure (presumably without realizing it), they recruited a palaeobotanical expert to erect a morphological partition.

Given the high quality of the matrix, this is an ideal example to demonstrate the utility of networks in (palaeo)phylogenetic research and to discuss the question of potential ancestor-descendant relationships, and their poor representation in trees (especially cladograms). Phylogenetic relationships within modern Juglandaceae are relatively well resolved. Rhoiptelea, a relict genus found in the mountains of northern Vietnam and south-western China, is sister to the remainder of the family — it is now subfamily Rhoipteleoideae, but was traditionally its own family. Rhoiptelea is an living fossil: flowers with fitting in-situ pollen and seeds have been found in the Late Cretaceous (Heřmanová et al. 2011, IJPS 172: 285–293; cryptically named Budvaricarpus serialis, the "Serial Budvarseed", because one is not allowed to use a modern-day genus for naming a 85–90 million year old angiosperm, even when it looks the same). The remainder of the Juglandaceae falls into two main clades, recognized as subfamilies:
  1. the Juglandoideae — the walnuts (Juglans) and their closest relatives: the (eastern) North American-East Asian disjunct genus Carya, the Eurasian relict genus Pterocarya (mainly Transcaucasia, East Asia), and the monotypic genera Cyclocarya and Platycarya.
  2. the Engelhardioideae — a group of tropical-subtropical, mostly relict genera: Alfaroa + Oreomunnea in the equatorial regions of the New World; and South East Asian-Malesian genus Engelhardia and the, probably monotypic, Alfaropsis widespread in China (sometimes still included in Engelhardia; e.g. current Flora of China, despite unambiguous molecular and morphological evidence).
Juglandaceae produce (winged) seeds and pollen that are relatively easy to identify. They are well-known and very common companions of palaeontologists during much of the Cenozoic, especially the (today geographically very restricted) Engelhardioideae. But in addition to the modern genera, the family includes some very interesting, unique fossils — the idea is to place these in a phylogenetic framework.

Results of the study of Manos et al. (2007).
Arrows indicate the position of the fossils. a) A majority rule consensus cladogram using a cut-off of 50 based on the morphological partition; b) the total evidence counterpart.

As can be seen from the above trees (taken from the paper), morphology reflects some of the molecular phylogenetic relationships — the Juglandoideae are supported as a clade, as are most genera (except for Engelhardia and Oreomunnea). Two fossils, Pal(a)eoplatycarya and Platycarya americana were resolved as sister taxa to their modern counterpart, Platycarya strobilacea; and the two enigmatic fossils Polyptera (the "many-winged one") and Cruciptera (the "cross-winged one") could be associated with the Juglandoideae. The total evidence approach indicated that Cruciptera is part of the "crown-group" Juglandoideae, in contrast to Polyptera, that appears at a more "basal" (root-proximal) position in this subclade. A sixth fossil, Pal(a)eooreomunnea could not be resolved with certainty (placed as sister to all Juglandoideae in the total evidence tree). As the name indicates, literally the "Ancient Oreomunnea", we would have expected it to group with the Engelhardioideae, which form a clade in the total evidence tree.

This is okay so far as it goes but, beyond potential sister relationships, these cladograms show very little. When I place a fossil such as Cyclocarya in the phylogeny, I would like to know whether it is more closely related to Juglans, Pterocarya or Cyclocarya. Is it an early sister lineage of all of these, or even a precursor? Cladograms cannot answer such questions.

The persistent issue of pseudo-clades

It has been pointed out in earlier posts that clades/grades are not necessarily synonyms of Hennig's concepts of monophyly and paraphyly, mainly because of convergent evolution creating data splits that are incongruent with the true tree. Parsimony-based analyses are especially vulnerable, because each change represents a step to be optimized.

One alternative method to place fossils in a (molecular-based) phylogenetic framework is the evolutionary placement algorithm (EPA; Berger & Stamatakis 2010, AICCSA conference paper). This changes to a probabilistic framework, and queries each fossil alone using its morphological partition but using the molecular-based tree as framework.

Summarized result of the evolutionary placement algorithm as implemented in RAxML.
The number represents a probability to join the fossil at the according branch using maximum likelihood as optimality criterion.

This gives the above tree as the result for the Walnut data set. Palaeooreomunnea is now unambiguously linked to one of the two included species of Oreomunnea, O. mexicana. Cruciptera is associated (again unambiguously) with Cyclocarya. Furthermore, not only are Palaeoplatycarya and the extinct North American Platycarya relatives of the modern-day Platycarya, but also Polytera. This, according to the original analysis, is the first-branching member of the remainder of the Juglanoideae, ie. all genera except Platycarya.

And the network shows us why

The most important problem with morphological data sets is that their signals are complex, and usually not very tree-like. Hence, whenever we optimize fossils along a tree (either by directly analyzing the morphological data or by some form of total evidence approach), the analysis has to fit in this odd little OTU at all cost, even when it means collapsing an entire clade. Simultaneous optimisation of two or more fossils triggers further branching artifacts, and may decrease branch support, because we have no molecular data compensating for eventual branch attraction conflicting with the actual phylogeny.

Let's take the Polyptera as an example. If we de-root the trees, the original total evidence placement and the ML-EPA are not that different from each other: Polyptera is just moved one node. A easily inferred Neighbour-net, which is not 1-dimensional like a phylogenetic tree, but 2-dimensional, shows the reason why (and only by using the morphological data partition).

The neighbour-net based on the Manos et al.'s morpho-data partition.
Numbers at branches represent nonparametric boostrap support (Least-squares and Maximum parsimony criteria) and Bayesian posterior probabilities.

  • We can see that Polyptera has a unique morphology (it shows the longest terminal edge of all fossils), making it equally similar to Platycarya and the remaining Juglandoideae: Juglans, Pterocarya, Cyclocarya, and Carya (Annamocarya is a not-widely-accepted Chinese genus, genetically indistinct from other East Asian Carya). This explains its instability in tree-based reconstructions. Assuming that Rhoiptelea points to the actual root, one could use the relatively high branch support values as an argument to say that Polyptera evolved after Platycarya split from the remainder of the Juglandoideae. But the network shows that the signal is not that straightforward, and Polyptera may just be a third lineage within the Juglandoideae (note the short orange edge bundle in contrast to the large red and green ones). A crucial question to check, also regarding the ML-EPA result, is whether the orange-edge clade (including Polyptera) is supported by uniquely shared characters and not just a tree-branching artifact because of the distinctness of the Platycarya group. Being substantially distinct (genetically and morphologically) from the remainder of the Juglandoideae, they must be placed as sister taxa. Being a fossil Polyptera is not that distinct, hence, placed in the Juglandoideae core clade. Distance-based and parsimony methods are more vulnerable to long-branch attraction (or short-branch culling) than is ML; and Bayesian analysis optimizes to a tree best comforting all signals in the data (compatible or not).
  • Cruciptera is more similar to Cyclocarya and Pterocarya than to Juglans, and represents a more primitive (ancestral) form. Based on the position of Cyclocarya and Pterocarya, we can directly conclude that they are morphologically less derived than Juglans, their sister taxon. Hence, one should be careful interpreting Cruciptera as a precursor of eg. Pterocarya, but would have to go back into the matrix and assess which characters differentiate within this part of the graph, in order to decide whether the similarity between them is a genuine representation of shared (common) origin, and not just due to symplesiomorphies.
  • The fossil counterparts of modern-day Platycarya span a quite prominent box-like structure in the network, but the blue edge has little support from tree-based analyses. A simple explanation would be that these two more ancient members of the Platycarya lineage, and are less derived than their modern counterpart and the other Juglandoideae.
  • Palaeooreomunnea is placed as one would expect for an ancestral form of the Engelhardoideae. It is clearly closer to the New World pair Alfaroa and Oreomunnea than to the Old World Alfaropsis and Engelhardia.
Data & software for EPA

The data matrix that I used for the ML-EPA, the Neighbour-net and the competing branch support analyses can be found in the supplementary information of the original paper.

EPA is implemented in RAxML since Version 7 and usually used to place environmental short sequence reads (Berger et al. 2011, Syst. Biol. 60:291–302). For a published application of EPA to place fossils, see e.g. Bomfleur et al. 2015, BMC Evol. Biol. 15:126.

Tuesday, January 2, 2018

Summarizing non-trivial Bayesian tree samples for dating? Just use support consensus networks


In a recent paper published in Systematic Biology, Joseph O’Reilly and Philip Donoghue (2017) shed some light on an issue concerning Bayesian analysis that has also bugged me since I first crossed paths with total evidence dating. Should we put dates on trees with topologies that may be “spurious”? Their answer is: "better not to". Based on their results, they advocate the use of majority-rule consensus trees (MRC), because maximum credibility clade (MCC) and maximum a posteriori (MAP) topologies may contain a critical number of erroneous branches.

I agree; but, being a notorious fan of non-trivial signals, in this post I will outline why one should generally use support consensus networks (SCN) to summarize the Bayesian tree sample, and then decide on those topological alternatives that are worth dating.

What O’Reilly and Donoghue found, and a simulation example

Using a series of simulated binary matrices and empirical datasets, these authors conclude that MCC trees, most commonly used by researchers doing total evidence (TE) or fossilized birth-death tip dating (FBD-TD), and MAP trees (rarely seen, but a reviewer asked the authors to include them, too) may contain too many erroneous branches (Fig. 1 provides an example). Low posterior probabilities are an alarm signal that should not be ignored. Being most conservative when it comes to accepting clades, MRC trees are hence less problematic.

Fig. 1 Tanglegram showing the true tree (left) in comparison to the inferred MCC tree.

But the problem naturally goes deeper: why can we have erroneous branches, and more importantly, low posterior probabilities?

When you have worked with a lot of messy datasets (ie. data with complex signal), you may have noticed that the optimized trees are not necessarily showing the best-supported splits. This also applies to ML optimizations, and molecular datasets (see example in my recent post). Morphological data are an especially challenging problem (post1/post2/post3/…). For the example in Fig. 1, the first of 10,000 MCCs O’Reilly and Donoghue inferred based on simulated data, it seems that:
  • all fossils are misplaced, some severely, but with consistently low support;
  • all deeper branches, branches near to the root, are (more or less) wrong.
A simple explanation for such a pattern is that the binary matrix is saturated, and hence shows a high level of homoplasy (like essentially all real-world morphological matrices). Later mutations (including many back mutations) overprint – to a certain degree – the signal of earlier mutations. How compatible are the signals from the matrix? Let’s take a look at the Neighbour-net and the matrix Delta value.

The prime problem: morphological data matrices provide no tree-like signals

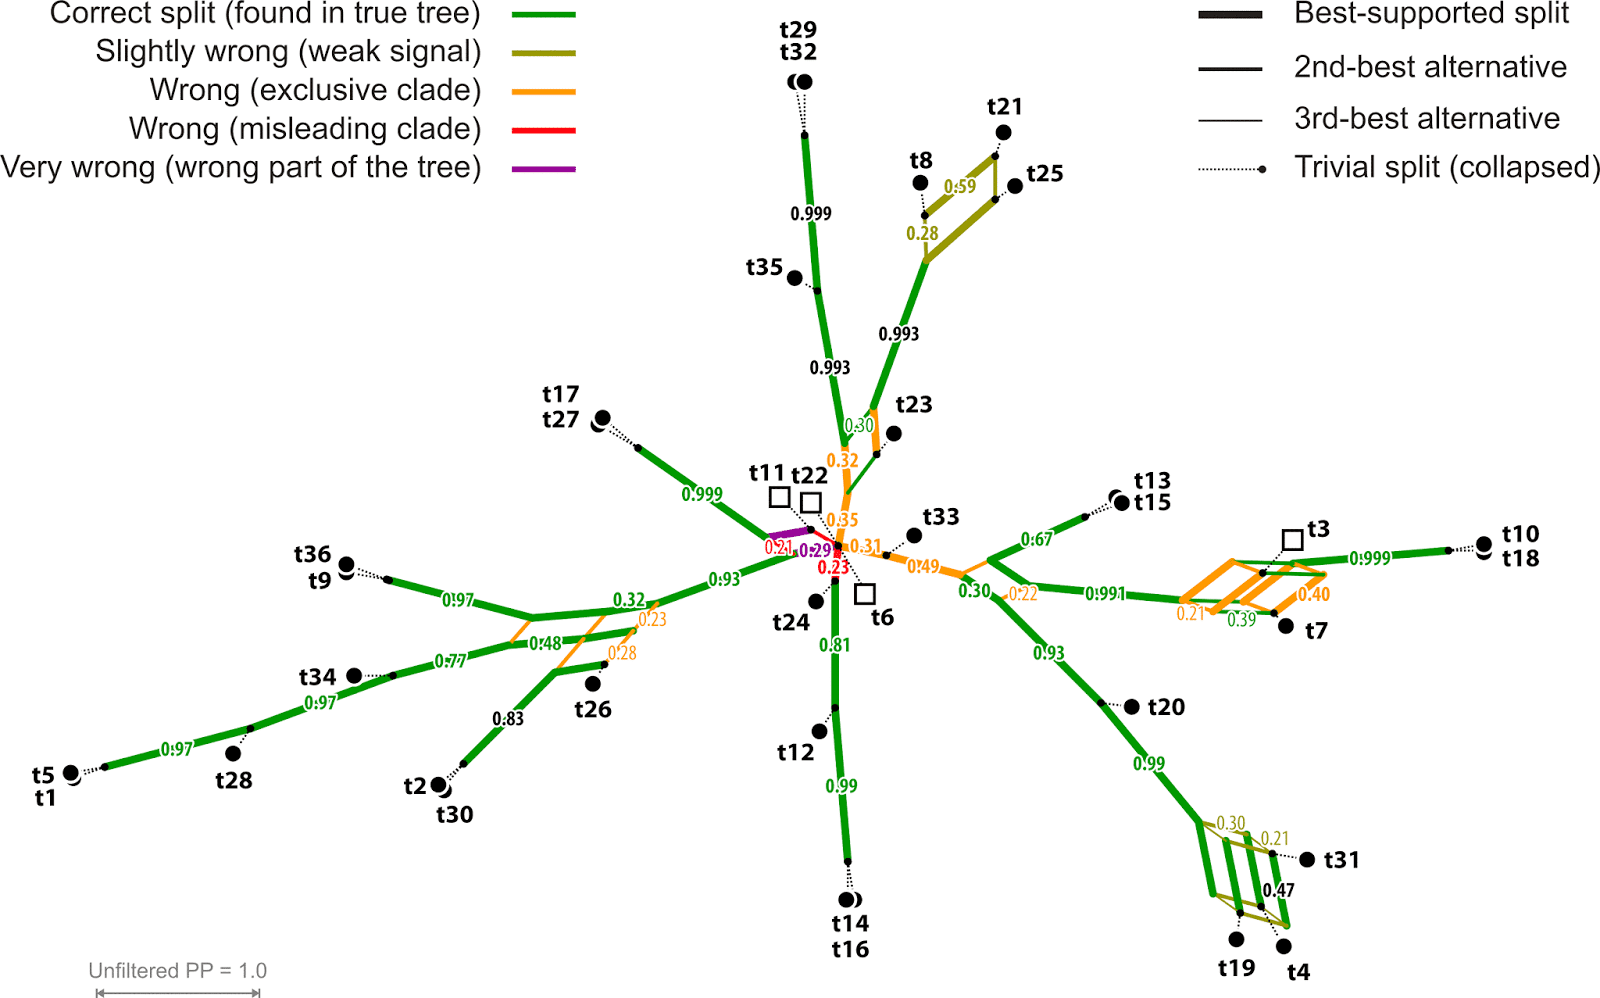
With a matrix Delta value of 0.37, the matrix falls within the usual range seen in real-world morphological matrices, providing mainly non-treelike signals. The Neighbour-net (Fig. 2) is consequently boxy, with the central part approaching a spider-web — a very common structure when analyzing real-world morphological matrices. The Neighbour-net thus explains why the Bayesian MCC tree (and the Bayesian optimization in general) fails so miserably regarding some branches but not others.

Fig. 2 Neighbour-net based on mean morphological distances estimated from the matrix used for the Bayesian inference. Edge-bundles corresponding to branches in the true tree are highlighted in green.

The Neighbour-net includes several prominent edge-bundles matching more terminal relationships in the true tree. In these cases, the matrix provides strong, coherent signal, as also expressed in nearly unambiguous PPs. Some taxa such as t23, t24, and t33 provide quite ambiguous signals, and they are accordingly misplaced in the MCC tree — this is the reason for very low PP in the corresponding portion of the tree.

Regarding the fossils:
  • Tip-close fossil t3, an extinct sister lineage of clade {t7 + [t10+t18]} is clearly a close relative of the latter, which is something also resolved in the MCC (slightly wrong but with low support; Fig. 1) and MRC trees (where t3, t7, and t10+t18 would be part of a soft polytomy)
Root-close fossils (phylogenetically speaking) t6, t11, and t22 are harder to place
  • t11 seems to have some weak and misleading affinity to t17+t27 (compare with Fig. 1);
  • t6 is correctly placed in between clade {t12 + [t14+t16]} and clade t8–t35; and
  • t22 could be interpreted as an early side lineage of the latter clade (t8–t35), too, which is not too wrong with respect to its position in the true tree (but wrong in the MCC tree; Fig. 1).

Fig. 3 The topology of the MRC (Bayesian majority-rule consensus tree) in relation to the distance-based Neighbour-net.

Why consensus networks are without alternative

The standard MRC trees would collapse, to so-called “soft” polytomies, all of the erroneous branches in this example, plus a few correct ones (Fig. 3). This avoids the problem of misleading branches; but it comes with the cost that we cannot establish a sensible phylogenetic hypothesis and may even lose correct branches (four in the example). The 50%-MRC tree for the example in Fig. 1 would have 14 clades / terminals emerging from the soft root polytomy, which would leave us with (14-2)² = 144 topological alternatives — this is too many to consider. Consensus networks can reduce these options (Fig. 4). Plus, they inform us of whether a low support value is due to lack of discriminating signal or to conflicting signal. In the case of the simulated data, it’s naturally more the latter.

Fig. 4 SCN (support consensus network) based on 10,000 Bayesian sampled topologies (BST) O'Reilly & Donoghue inferred for their simulated data set Mk100/1.
Splits found in less than 20% of the BST not shown; trivial splits collapsed.
This sample was the basis for selecting the MCC (Fig. 1) and computing the MRC (Fig. 3) trees. Note how the soft polytomies in the MRC can be resolved into few competing alternatives.

Total-evidence can circumvent this problem to some degree, because the molecular data (in the optimal case) will constrain a backbone topology, which the morphological partition will have to fit into. Bayesian inference eliminates internal data conflict, as the chain optimizes towards a topology, or set of topologies, that best explain all data. This can have a streamlining effect on deep relationships, where the signal from the morpho-matrix is usually diffuse, but also towards the terminals. Here, the putative convergences conflicting with the molecular tree will be effectively down-weighted during the optimization.

Nevertheless, there are limitations. When the fossils show overall primitive or well-mixed character suites, there will be more than one possible placement. The consequence is topological ambiguity expressed in split support patterns. This is also the case for many fossils included in the dataset used in the original study introducing Bayesian TE dating (Ronquist et al. 2012), and as empirical examples in O’Reilly & Donoghue's assessment of MCC, MRC, and MAP trees.

Fig. 5 SCN (support consensus network) based on the 1000 last BST of both runs performed by O'Reilly & Donoghue on the full data set of Ronquist et al. (2012).
Blue edges refer to the branches seen in Ronquist et al.'s dated MRC tree (their fig. 7); modern-day groups and potential fossil members (open squares) coloured according to Ronquist et al. (2012: fig. 3). Filled circles: modern-day taxa. Note the prefential placements for a number of fossil taxa, which formed part of large, soft polytomies in the dated MRC tree. For instance, Palaeathalia, a fossil with highly ambiguous signal, is unresolved within the Tenthredinoidea clade in the MRC trees (emerges from a pentatomy, i.e. 52 = 25 principal topological alternatives). Based on the SCN, the number can be reduced to ten alternatives, which boiled down to three principal ones: sister to Tentredinidae, Blasticotomidae or all of Tenthredinoidea except for Blasticotomidae. The latter potentially including two additional fossils that are also part of the Tenthredinoidea pentatomy.

This is also the reason why we relied on fossilized birth-death dating for the Osmudaceae (Grimm et al. 2015). The earliest (Jurassic) representatives of the modern Osmundaceae (= Osmundeae according Bomfleur et al. 2017) that could be included in the total-evidence matrix shared many rhizome traits with the least-derived extant lineages (genera Claytosmuna and Osmunda; PPG I 2016). The signal from the morphological partition is not tree-like (see Bomfleur et al. 2015, fig. 8) and the total-evidence MRC accordingly collapsed with only the position of a single (unambiguous) rhizome fossil (Todea tidwellii) being fully resolved (Fig. 6).

Fig. 6 Total-evidence (TE) dating (Grimm et al. 2015) using the oligogene data by Metzgar et al. (2008; resulting in a fully resolved, unambiguously supported tree) combined with a morphological partition scording for rhizome traits of modern Osmundaceae (= Osmundeae according Bomfleur et al. 2017).
Four issues hinder the application of TE dating for this data set: 1. Poor backbone resolution (low, ambigous PP) preferring misleading relationships (cf. Bomfleur et al. 2015, 2017; Grimm et al. 2015). 2. The extant members of genera Claytosmunda, Osmunda, Plenasium are embedded in a large soft polytomy including fossils with the more primitive Claytosmunda-Osmunda rhizome morphologies. 3. Jurassic representatives of Osmundastrum (likely monophyletic) and Claytosmunda (paraphyletic according Bomfleur et al. 2017) form a poorly resolved "basal grade". 4. First representatives of Claytosmunda, Osmundastrum, and the Todea-Leptopteris lineage can be found in the Triassic, but cannot be included in a TE tree-inference framework (Bomfleur et al. 2017, fig. 15, section 2.2.3).
Fig. 6 (ctd) The results of fossilized-birth death datings that used only the frond (not used for TE dating) or rhizome fossils (same set than used for TE dating).
Osmundaceae foliage (sterile and fertile fronds) can be very characteristic and be traced in the fossil record, but provides only very few scorable traits. Shown chronograms modified from Grimm et al. (2015), supplement-fig. S2. Todinae: L. = Leptopteris, T. = Todea; Osmundinae: C. = Claytosmunda, O. = Osmunda, Om = Osmundastrum, P = Plenasium (cf. PPG I 2016; Bomfleur et al. 2017)


Shall we stop using TE dating?

Naturally, dating a MRC tree with large, deep polytomies (Figs 5, 6) will not be very revealing (Fig. 7). So, even though they are much less prone to error than MCC trees, they don’t provide a practical alternative. However, by using the SCN (support consensus network) we can:
  • depict the most likely (in a literal sense) topological alternatives (evolutionary scenarios); 
  • constrain their main aspects; 
  • date each of the resulting evolutionary scenarios; and 
  • compare the outcome. 
In the case of fast radiations, even fundamental changes to the constrained topologies will have little effect on the dating estimates (short branches)— even poorly resolved trees can provide age estimates that make sense (e.g. Grímsson et al. 2017). Really problematic involve only long(er) branches with poor support, preferred over equally or better supported alternatives.

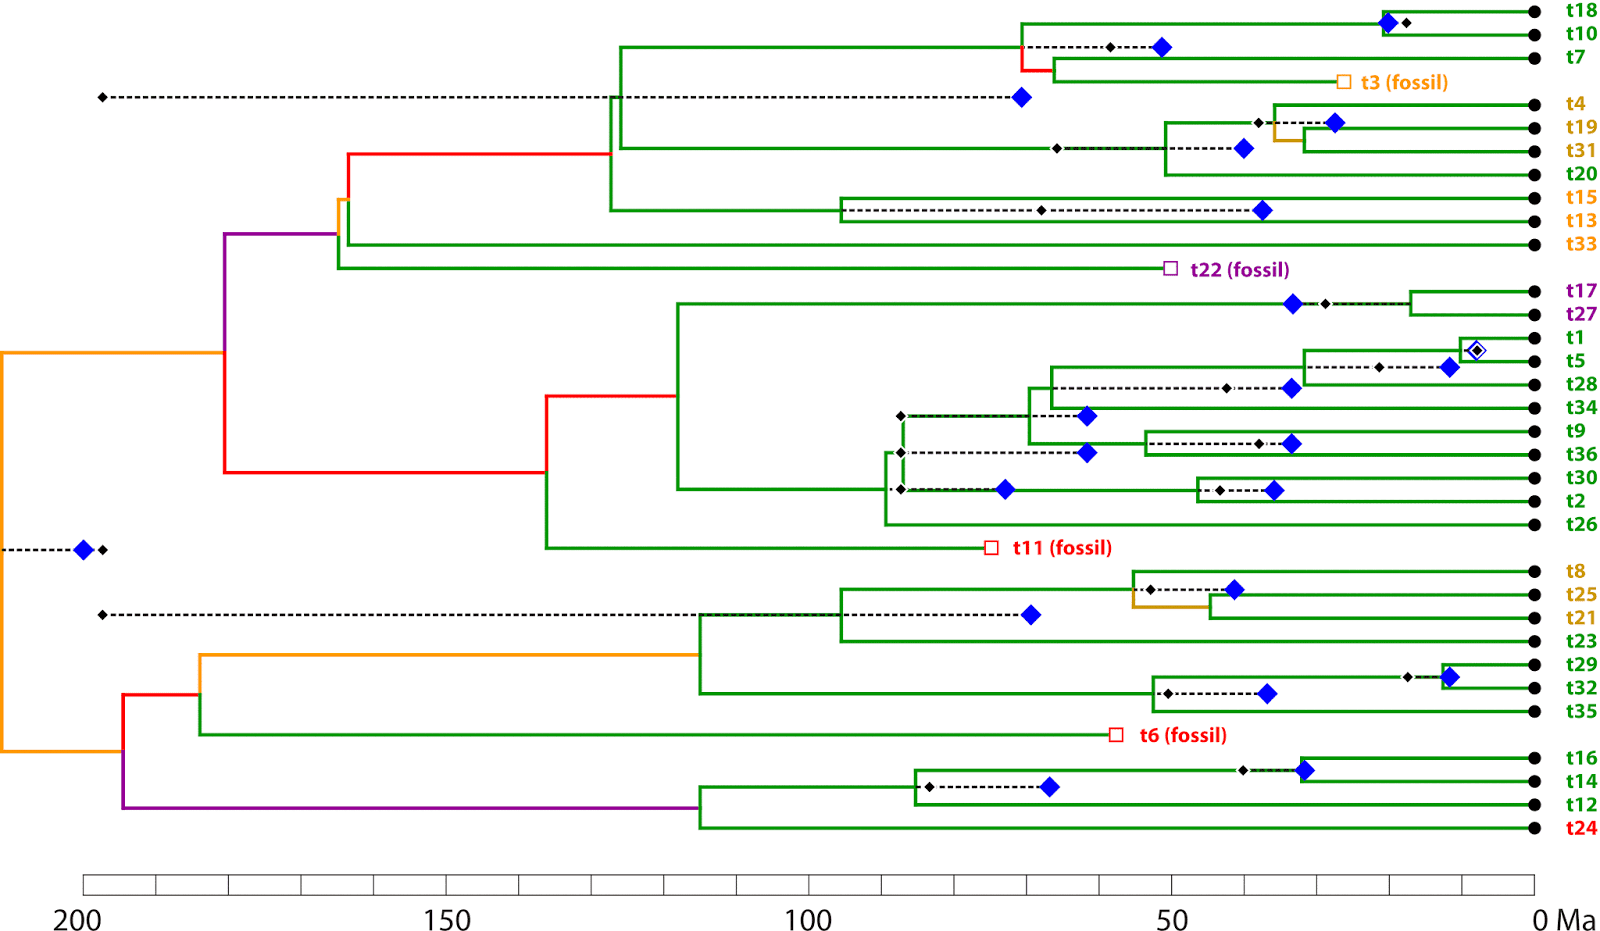
Fig. 7 Variation in total-evidence dating estimates for the simulation example in Fig. 1 (O'Reilly & Donoghue's matrix Mk100/1).
The scale has been adjusted to fit the fossils' relative ages and assuming an actual (real) root age of 200 million years (Ma). Shown is the MCC chronogram, the estimates of corresponding nodes according to the equally scaled MRC tree (black diamonds), and the target divergence ages (blue diamonds) according to the true tree (the tree used to simulate the data). The saturation of the morphological partition triggers too long terminal branches in both the MCC and MRC trees, hence, most mid-topology estimates are overestimating. MRC-derived estimates can be better than MCC estimates, but also much worse due to collapsed soft polytomies. Note that in the case of real-world data, the molecular partitions may compensate for the branching-length bias to some degree (see also Fig. 6).

Furthermore, the SCN will point us to the ‘weak spots’ in our fossil-inclusive phylogeny, and also to the rogues — fossils with strongly ambiguous (non-treelike) signal that mess up any tree inference. For dating, we need a tree, and hence a set of taxa providing a tree-like-as-possible signal (see the reduced data set used in Ronquist et al. 2012 for the in-text figures). For all other data sets, where ambiguous signal from fossils and morphology is inevitable, the (original) fossilized birth-death dating remains the best option.

However, be careful with the new tip-dating option, because this again assumes that the position of fossils can be unambiguously optimized in the tree.

One thing is clear: (largely) ignoring the fossil record when doing molecular dating to infer organismal histories is the worst of all possibilities.

Thanks

To Joe O'Reilly for providing the Bayesian result files (BST samples, MCC and MRC trees) used in their study.


Related posts

Why we should use consensus networks to summarize Bayesian analysis:
Issues with node dating that may effect TE dating, too, and can only overcome by using the entire fossil record of a group (FBD dating
Non-treelike morphological data used to infer (strict) consensus trees:
Stacking neighbour-nets, a real-world example using the Osmundaceae matrix (matrices) of Bomfleur et al. 2017

References

Bomfleur B, Grimm GW, McLoughlin S. 2015. Osmunda pulchella sp. nov. from the Jurassic of Sweden—reconciling molecular and fossil evidence in the phylogeny of modern royal ferns (Osmundaceae). BMC Evolutionary Biology 15:126. http://dx.doi.org/10.1186/s12862-015-0400-7

Bomfleur B, Grimm GW, McLoughlin S. 2017. The fossil Osmundales (Royal Ferns)—a phylogenetic network analysis, revised taxonomy, and evolutionary classification of anatomically preserved trunks and rhizomes. PeerJ 5:e3433. https://peerj.com/articles/3433/

Grimm GW, Kapli P, Bomfleur B, McLoughlin S, Renner SS (2015) Using more than the oldest fossils: dating Osmundaceae with the fossilized birth-death process. Systematic Biology 64: 396–405.

Grímsson F, Kapli P, Hofmann C-C, Zetter R, Grimm GW (2017) Eocene Loranthaceae pollen pushes back divergence ages for major splits in the family. PeerJ 5: e3373. https://peerj.com/articles/3373/

Metzgar JS, Skog JE, Zimmer EA, Pryer KM. 2008. The paraphyly of Osmunda is confirmed by phylogenetic analyses of seven plastid loci. Systematic Botany 33:31–36.

O'Reilly JE, Donoghue PCJ (2017) The efficacy of consensus tree methods for summarising phylogenetic relationships from a posterior sample of trees estimated from morphological data. Systematic Biology https://academic.oup.com/sysbio/advance-article-abstract/doi/10.1093/sysbio/syx086/4587515

PPG I. 2016. A community-derived classification for extant lycophytes and ferns. Journal of
Systematics and Evolution 54(6):563–603 http://onlinelibrary.wiley.com/doi/10.1111/jse.12229/epdf

Ronquist F, Klopfstein S, Vilhelmsen L, Schulmeister S, Murray DL, Rasnitsyn AP (2012) A total-evidence approach to dating with fossils, applied to the early radiation of the hymenoptera. Systematic Biology 61: 973–999.

Monday, January 13, 2020

Why we may want to map trait evolution on networks, pt. 2 – Topological ambiguity


In last week's Part 1, I gave an introduction to the problem of categorizing the polarity of morphological traits. How can we reconstruct which characters are primitive, or plesiomorphic according to Hennig, and which are derived, or apomorphic? This is something we need to do to reconstruct evolution, because most of the past is only preserved in the form of fossils, usually lacking any DNA. In this second part of the discussion, I'm going to take apart my own tree and show why we inevitably need networks, not trees.

There may be more than one tree

Even with more and more data at hand, some molecular phylogenies refuse to be unambiguous. Even worse, different, well-sampled molecular data sets may tell different stories — ie. there is more than one molecular tree to explain the diversity patterns. The ML tree used for the ML character mapping in Part 1 was pretty well supported, but not telling the entire truth.

For a start, there is no reason to assume that oaks are not monophyletic even though the data fail to resolve them as a clade (evolving something unique like the oaks twice would be a striking trick, even for gambling Mother Nature) — molecular trees may have misleading, sometimes just wrong, branches, even when they are highly supported.

In this case, one complication is that the oligogene dataset combines plastid and nuclear gene regions that not only differ in their information content but also infer different phylogenetic scenarios (and mask a lot of intra-generic and sub-generic incongruencies). This is illustrated in the following tanglegram.

Fig. 3 – A tanglegram, on the left the ML tree inferred from only the plastid gene regions (1406 DAP, alignment 15254 bp long), and on the right the corresponding nuclear data based tree (1691 DAP per only 4983 bp).

Even though the support along the backbone of the plastid tree is lowa (to non-existent), it well reflects the general diversification patterns in Fagaceae plastomes (see also the tree in Manos et al. 2008, Madroño 55:181–190; and Yan et al. 2019, BMC Evol. Biol. 19: 202, for an oak global picture). Plastid signatures show a strong geographic sorting (eg. New World vs. Old World), while the nuclear data provides most of the lineage-differentiating signal expressed in the combined tree (Part 1, Fig. 2).

Mapping along networks

How do we decide what is a real synapomorphy, a homoiology, or a good symplesiomorphy? Mapping the traits along all possible rooted trees is one option. Another option is to just map them along a consensus network of all trees, as shown next.

Fig. 4 – Map of the seven characters on the consensus network of the nuclear and plastid trees shown in Fig. 3. Blue – genus autapomorphies, dark green – synapomorphies/terminal homoiologies, light green – symplesiomorphies, orange – deep homoiologies, red – randomly distributed trait, pink – genus-restricted reversals.

According to the mapping, the newly described South American Castanopsis rothwellii, assigned to the modern (Souteast Asian) genus Castanopsis, is a stem Castanoideae / Fagaceae, while the "extinct" North American genus Castanopsoidea (then the "earliest megafossil evidence of Fagaceae": Crepet & Nixon 1989, Am. J. Bot. 76: 842–855) could be a stem / crown member of the Castanea-Castanopsis lineage. The difference to the ML trait mapping (Fig. 3 in Part 1) on the combined tree is that we get a better picture what is a lineage-specific trait set in Castanea-Castanopsis, because the interference of the monophyletic(!) oak grade is minimized.

Another possibility is to map the characters directly along a distance-based network, and then compare the latter with the molecular-based topological alternatives. This is quite puzzling in this case, because the morphology (Fig. 1 in Part 1) matches neither the nuclear tree nor the plastid tree (Figs. 2–4) — the traits scored for the fossils cover largely morphological Play-Doh of the Fagaceae.

Fig. 5 – Neighbor-nets based on mean morphological distances. Top graph – polymorphisms treated as ambiguities (standard approach), bottom graph – polymorphism treated as additional states (experimental approach). Text coloring as in Fig. 4, light blue – potential autapomorphy of the fossil American castaneoid lineage. Edge colors: green – edge representing a molecular clade/likley monophyletic group; orange – edge representing a paraphyletic group; red – edge rejected by molecular data; blue – edges supporting a distinct fossil American castaneoid lineage.

The likely primitive characters, irrespective of the evolutionary scenario we prefer, are those also found in the Eocene fossilsb. There are no derived traits/character suites pinning the fossils to Castanopsis. The fossils are a bit derived on their own terms (note their position in Fig. 5), and hence we can deduce that the fossils are either: (a) representing a relatively primitive extinct American sister lineage or (b) surviving, somewhat evolved members of the precursors of modern-day core Fagaceae. Note that the derived oaks evolved nearly 60 myrs ago, ie. 8 myrs before the oldest (Patagonian) Castanoideae fossil was deposited. The earliest (known) Fagaceae and castaneoid pollen are from 80+ Ma old Upper Cretaceous sediments in western North America (Grímsson et al. 2016, Acta Palaeobot. 56: 247–305; open access) and Japan (Takahashi et al. 2008, Intl. J. Plant Sci. 169:899–907), giving them plenty of time to migrate into North and then South America during the Paleocene-Eocene green house episode.

Fig. 6 – Earliest fossil record of Fagaceae and Castanoideae mapped on Scotese's Paleoglobes (© Scotese 2013, GoogleEarth layover files are available from here). Note that although there was no continuous land bridge, North and South America were already connected by a chain of large and high islands, providing a corridor for intercontinental dispersal of near- and extra-tropical plant lineages. A potential  crown-group Castanopsis (C. kaulii, cupule with associated seeds and pollen) has been recently recovered from the Baltic Amber (Sadowski et al. 2018 Am. J. Bot 105: 2025–2036).

Both of the mapping procedures described above are crude, in the sense that they ignore the molecular branch lengths, and use Ockham's Razor. But it strikes me as being not a bad start. They are better than just mapping along a single preferred molecular tree (as is done in many neontological papers; see Part 1) or along a morphology-based strict consensus cladogram (as is done in far too many paleontological papers; many palaeobotanical papers do neither the one nor the other: eg. Wilf et al., 2019, Science 364: eaaw5139). It's important to realize that if one taxon or subtree of our modern taxon set is characterized solely by the lack of shared derived traits or unstable expression of derived traits (like Castanopsis here, see position in both graphs in Fig. 5), ie. represents living fossils or little-evolved lineages, any ancient and primitive fossil, stem group, sister group or precursor, will be attracted by them in a total evidence or any other tree-based approach, especially when we rely on change-probability-naive parsimony as inference criterion. As we pointed out repeatedly: forming a clade in tree is neither a necessary nor a sufficient criterion for monophyly.

All gone, what to do when we have no molecular data?

Morphology alone, like genes on their own, will inevitably get some things wrong (compare Fig. 4 with Fig. 5). Without molecular data, one may have little reason to reject the monophyly of the Castaneoideae (when using more than the seven characters scored by Wilf et al. 2019; see eg. the cladogram in Crepet & Nixon 1989, fig. 1 based on an undocumented 25-character matrix). In the process, we would misinterpret overall similarity, due to shared primitive character suites and the lack of shared derived traits as evidence for an inclusive common originc.

What can we do if we have no or very few extant taxa, when we only have one set of data prone to circular reasoning? Then using networks is inevitable as well (see Fig. 5; and some examples provided in the reading list below). We need to explore in-depth the signal in our data matrix. Only extremely biased morphological matrices provide clear tree-like signals, comprehensive ones will have internal conflict and allow for inferring many, partly very different but more or less equally optimal trees.

Exploratory data analysis will not eliminate all possible errors — based only on the graph in Fig. 5, we would get the inter-generic phylogenetic relationships in Fagaceae partly wrong. However, this may lead to an informed decision as to which of the many equally probable evolutionary scenarios make more sense than others. It will help to reduce the alternatives, without eliminating those that are equally valid (which every tree does). If the time-coverage is good, exploring morphological differentiation over time can be an asset, too (see eg. Stacking neighbor-nets – a real-world example).

Data

The matrices used, networks etc. can be accessed via figshare.

Selection of related posts on The Genealogical World of Phylogenetic Networks

Clades, Cladograms, Cladistics, and why networks are inevitableillustrates why paleontologists should also be less tree-naive (see example in footnote c).
Has homoiology be neglected in phylogenetics? — why we should try to assess the phylogenetic quality of our traits.
Let distinguish between Hennig and Cladisticsas said in the title, the post provides reasons why we should distinguish between Hennig's concepts and clades in phylogenetic trees.
Ockham's Razor applied, but not used: can we do DNA-scaffolding with seven characters? — the original post dealing with Wilf et al.'s (2019) "phylogenetic analysis", which obviously was not scrutinized during review.
Please stop use cladograms!No matter whether you think evolution is tree-like or not, cladograms should be a matter of the past.
Should we try to infer trees on tree-unlikely matrices? —  using well-known (among paleobotanists) examples, I show why networks reveal much more than any tree when we deal with fossils.
More non-treelike data forced into trees: a glimpse into the dinosaursthe same but for a thunder lizard matrix.
Trivial data, but not so trivial graphsan inference experiment using very simple artificial binary matrices.


a The main reason for the lack of branch support is that individuals of different genera growing in the same area can share plastid haplotypes, while individuals of the same genus / infra-generic lineage, even species, can be quite different. [Note that the standard 4x4 ML nucleotide model treats polymorphisms as such, not as missing data.] Plus, the different lineages show different levels of plastid diversity (highest in Quercus subgenus Cerris, but low in subgenus Quercus, the North American castanoids and Lithocarpus outside Borneo, Castanea-Castanopsis appear to be in-between the extremes), and there is a tendency to preferably mutate sequence patterns within a lineage that otherwise differentiate between lineages (for instance, inversions that distinguish two genera, can be found as intra-lineage variation in the third genus or one of the oak sections).

b The striking similarity between the newly found South American and long-known slightly older North American fossils is likely the reason for not discussing the latter in the original paper or including them in the "DNA-scaffold" analysis. As is obvious from the graphs, the slightly younger North American fossil could easily be a slightly more derived of the same lineage than the South American fossil (Planchard et al. 2016 Paleont. Electr. 19.3.51A give a revised age of ≥ 49 Ma for the plant-bearing strata), and thus would have been at odds with the narrative of the authors (see also comment by Denk et al. 2019, Science 10.1126/science.aaz2189).

c As done by Wilf et al. (see also the argumentation in Wilf et al.'s response, Science 10.1126/science.aaz2297, to Denk et al.'s 2019 comment). The combination of circular reasoning, systematic bias, and (parsimony) tree-naivity is well expressed in Wilf et al.'s own words:
Fourth, Denk et al. erroneously contend that Castanopsis rothwellii, a fossil with so many diagnostic characters preserved that it could only be assigned to Castanopsis if “found alive” today (1), has plesiomorphic features and cannot be placed confidently in the extant genus [see Figs. 1–5 in this two-part post]. ... Denk et al.’s phylogenetic conclusions from their emended tree and matrix are misleading, in that any morphological matrix includes characters that are relevant only for the taxa included in the analysis. ... Because the fossils are castaneoid in all features, we did not include all Fagaceae in our original analysis (1) and likewise did not include all characters relevant to non-castaneoid fagaceous taxa. ... By adding just three relevant characters to the Denk et al. scaffold to accommodate the genera they added (Table 1), the fossil Castanopsis rothwellii is placed only with Castanopsis in the single [ie. the strict consensus of two equally parsimonious trees] most parsimonious tree (Fig. 1).
One of the three added traits ("expanded stigma") is exclusively shared by all five Castaneoideae genera, the second ("nut generally rounded in cross section") shared by all but one Castaneoideae and Quercus, and thus are symplesiomorphies of core Fagaceae: shared primitive traits that can be expected in a precursor of several or all modern genera or their less evolved extinct sister lineages. Or positively selected homoiologies, ie. evolved multiple times within the core Fagaceae. The third ("asymmetrical cupule") is an unstable convergence / deep parallelism and a trait of little phylogenetic value, since expressed as intra-generic (intraspecific?) variation in two distantly related genera: the monotypic Formanodendron, a trigonobalanoid, and Castanopsis. These are two genera that share only a very distant (and exclusive fide Hennig) common origin (see Part 1) but inhabit overlapping climate envelopes and ecological niches in modern-day East Asia.

Despite adding three hand-picked characters (from a set of at least 25 at hand, Crepet & Nixon 1989) and accepting a phylogeny closer to the reality, the Castanopsis "clade" in the new "scaffold tree" including the Patagonian fossil remains unsupported by any exclusive or even shared and stable derived trait/set of traits (as in the original study, Wilf et al. refrain from establishing any sort of node or branch support, or test of alternative placements).

Moreover, it is safe to assume that when one adds the extinct genus Castanopsoidea to the scaffold (Wilf et al. deliberately chose not to do so), it would compete with Castanopsis rothwellii for the placement next to the modern-day Castanopsis. According to Crepet & Nixon 1989, fig. 1, one possible placement of Castanopsoidea is a sister to "Castanopsis (1)". This is not necessarily because they share a direct common origin but because these fossils also lack uniquely derived characters or a clearly derived character suite defining all Fagaceae genera except for Castanopsis (which in Crepet & Nixon's morpho-tree, is paraphyletic to Lithocarpus, which, back then, included the potential oak sister genus Notholithocarpus — literally: the 'false Lithocarpus'). Personally, for the same reasons as outlined and applied in Bomfleur et al. 2017, PeerJ 5: e3433 (and like Denk et al. 2019), I would have no problem calling all these fossils Castanopsis by defining the genus as explicitly paraphyletic, which could include the modern-day species of Castanopsis (which are probably monophyletic) and Castanopsis-like fossils that may be more or less related to them and/or other core Fagaceae: the precursors and extinct but similar, underived sister lineages.

Monday, June 11, 2018

Want to place a fossil in a minute? Just use Neighbour-nets


Palaeontological phylogenetic researchers typically put a lot of effort into inferring trees. It has been argued (and occasionally pointed out during manuscript reviews) that only by placing a fossil in an explicitly phylogenetic framework can we assess what it represents. I sympathize with this notion, but in most cases we don't need any elaborate analysis to do it — a quick network-based analysis will do the trick.

In this post, I'll demonstrate my point using the most recent matrix presented by two eminent plant morphology veterans. In a fresh-off-the-press paper, James Doyle & Peter Endress provide a "Phylogenetic analysis of Cretaceous fossils related to Chloranthaceae and their evolutionary implications" (Botanical Review) using their morphology matrix focussing on early diverging angiosperm lineages, which was originally used for a paper by Sareela et al. (Nature 446: 312–315, 2009) and has been continually updated.

Like all morphological matrices that aim to cover as much as possible, Doyle & Endress' matrix does not provide any strong tree-like signal, and hence it has little use for inferring phylogenetic trees. Doyle & Endress deal with this issue by using a (more or less molucular-based) backbone tree enforcing several clades for the modern taxa, and then trying to find the most parsimonious placement of the fossil(s). This approach works to some degree but has two problems: one theoretical and one practical.

First, the backbone tree, or any molecular-informed topology, is usually some steps longer than the most-parsimonious trees that could be inferred on their matrix. In other words, morphological evolution in plants doesn't fully fulfill Ockham's Razor. Why should this also be the case for the fossils?

Second, moving a fossil through the branches to find the best-placement takes some time, and will lead to many equally parsimonious solutions. Not rarely, the fossil can be placed on quite distant branches, producing trees that are only a few steps longer.

A graph I made depicting the 'parsimoniousness' of placing a fossil, Monetianthus (a Cretaceous water lily), within a given topology using an earlier version of Doyle & Endress' matrix (fig. 7 in Friis et al., Int. J. Plant Sci., 2009). The number of additional steps was estimated by moving the target taxon, the fossil, to the accordingly coloured branch of the tree. (PS To show that the fossil is a water lily, a Nympheaceae, we used a Neighbour-net)

For Doyle & Endress' papers this is no big problem, because they just show the best placements as well as those a few steps longer. For example:
Placing the Chloranthistemon species on the stem lineage of Sarcandra and Chloranthus is four steps less parsimonious than placing them on the stem of Chloranthus. For perspective, only two steps are added if the Asteropollis plant is moved to the stem of the whole family. If a four-step parsimony debt is accepted in moving Chloranthistemon to a morphologically less favored position, one may ask why the Asteropollis plant is considered a reliable minimum age constraint for the family.
But with respect to the fact that morphological evolution is not necessarily parsimonious, and that even the modern taxa can show variable root to tip pathlength distances, I always remain skeptical of this approach.


A Bayesian-inferred angiosperm tree based on a total-evidence matrix, built from a curated version of Soltis et al.'s 2011 matrix and including the 2010-version of Doyle & Endress' matrix as morphological partition (provided as open data @ figshare). Note that many fossils (Cretaceous, ~100 Ma) have longer terminal branches than their surviving relatives (hence, made Bayesian total evidence dating impossible).

Aside from this, the matrix signal is pretty straightforward when it comes to decide on the potential position of the fossil in the angiosperm part of the Tree of Life. And the analysis takes (literally) moments.

You just take the matrix, calculate mean pairwise morphological distances (done in a blink), export the distance matrix as NEXUS-formatted file and input this to SplitsTree, which will give you a Neighbour-net (in another blink).

A Neighbour-net based on Doyle & Endress' 2018 matrix including only the modern-day taxa.

Most members of the well-established clades, main angiosperm lineages, cluster in the Neighbour-net (bracketed names point to somewhat scattered clades). In case the signal from a fossil is trivial, it will be nested within the respective cluster. Trivial signals are when a fossil has a character suite that indicates it is much more similar to one of the clusters than to any other, which usually means that it is part of the same evolutionary lineage. Convergences may be common, and characters homoplasious, but evolving the exact same suite of characters while not sharing common ancestry is quite unlikely.

The Neighbour-net including the matrix' fossils. Note that the relative position of the Eudicots has changed and Circaeaster and Euptelea are placed closer to the other Ranunculales, although the pairwise distances between all modern taxa have not changed. The re-arrangement is solely a fossil-inclusion effect. By adding fossils attracted to Ceratophyllum, this enigmatic and isolated genus is drawn away from the most basal eudicots.

Two of the fossils apprear to have unique character suites, placing them intermediate between two phylogenetically isolated plants, the unique Amborella (still considered the earliest branching modern-day angiosperm; one species on New Caledonia) and Ceratophyllum, an equally enigmatic water plant. The remainder are clearly members of the Chloranthales.


Having identified the phylogenetic Neighbourhood of the fossils, we can then focus on this neighbourhood (in SplitsTree: Select the comprising OTUs; then go to menu Data > Keep only selected taxa).

The Neighbour-net after all non-neighbourhood OTUs have been removed.

From this graph we can directly conclude:
  • The Asteropollis plant is a close relative, likely a sister or early representative, of Hedyosmum.
  • Couperites represents an early and substantially diverged lineage within the Chloranthales — its closest living relative appears to be Ascarina, next to Hedyosmum the most derived living Chlorantales (here: one would need to see if there is any shared character suite).
  • Zlatkocarpus is an ancestral form of the Chloranthales core clade, comprising Ascarina and the sister taxa Chloranthus and Sacandra (one would need to check the possibility that this could be a missing data artefact).
  • Canrightia and Canrightiopsis are sister lineages or precursors of Chloranthus and Sacandra (see the open access tree-and-network-based paper by Friis et al. 2015, Grana 54: 184–212)
  • The Pennipollis plant is an ancient isolated Chloranthales lineage, with no living relative.
  • Appomattoxia and Pseudoasterophyllites may be (very) distant relatives of Ceratophyllum, the latter an isolated genus that has long been and still is a problem for molecular phylogenies. Alternatively, they may represent early and extinct angiosperm lineages (or the same lineage) with no modern counterparts.
To say anything beyond this based on the current data set quickly leaves the grounds of objectivity, and requires a priori assumptions about the importance of certain morphological traits being shared or not (i.e. not expressed, not just missing due to poor preservation).

[For those interested in a formal discussion of these results, see Doyle & Endress, 2018, pp. 7–25.]

To refine the analysis, we can just reduce the character set to the characters scored for the fossils.

A Neighbour-net based on distances computed using a character-subset generated by excluding all invariable characters (in PAUP*: Exclude constant) for the taxa included in the network (66 characters, including eight not defined for any fossil taxon). Grey depicts a (molecular-data backed) tree hypothesis that could explain the seen differentiation pattern

To take the next step, morphological matrices alone will have no practical use, because they will not allow us to identify fast vs. slow evolving traits and lineages. A lineage that goes through bottlenecks or colonizes new niches will be genetically, and morphologically, more distinct than one that remained in calm waters. One could map the preserved traits found in each fossil onto a molecular tree, and include the information about actual branch lengths in that tree to put forwards hypotheses about the ancestral state (e.g. Mendes et al., Grana 53: 283–301 [open access] for Lardizabalaceae), and possibly even time the divergences. This would enable one to compare the situation in the fossils with the top-down hypotheses about morphological evolution for the very same time period.

But that would be mostly tree-based analyses, and thus nothing for a Genealogical World of Phylogenetic Networks post.

Data — In case you are interested in the primary data matrix, a ready-to-use NEXUS version and the raw Split-NEXUS files have been uploaded to figshare.

Monday, June 17, 2019

Ockham's Razor applied, but not used: can we do DNA-scaffolding with seven characters?


One of the most interesting research areas in organismal science is the cross-road between palaeontology and neontology, which puts together a picture marrying the fossil record with molecular-based phylogenies. Unfortunately, when it comes to plant (palaeo-)phylogenetics, some people adhere to outdated analysis frameworks (sometimes with little data).

How to place a fossil?

The fossil record is crucial for neontology as it can provide age constraints (minimum ages when doing node dating) and inform us about the past distribution of a lineage. This, especially in the case of plants that can't run away from unfortunate habitat changes, can be much different than today.

The main question in this context is whether a fossil represents the stem, ie. a precursor or extinct ancient sister lineage, or the crown group, ie. a modern-day taxon (primarily modern-day genus). For instance, the oldest crown fossil gives the best-possible minimum age for the stem (root) age of a modern lineage, whereas a stem fossil can give (at best) only a rough estimate for the crown age of the next-larger taxon/clade when doing the common node dating of molecular trees (note that fossilized birth-death dating can make use of both).

There are two commonly accepted criteria to identify a crown-group fossil:
  1. Apomorphy-based argues that if a fossil shows a uniquely derived character (ie. a aut- or synapomorphy sensu Hennig) or character suite diagnostic for a modern-day genus, it represents a crown-group fossil.
  2. Phylogeny-based aims to place the fossil in a phylogenetic framework, the position of the fossil in the genus- or species-level tree (most commonly done) or network (rarely done but producing much less biased or flawed results) then informs what it is.
(We will focus on members of modern-day genera, since it becomes more trickier for higher-level taxa, see eg. my posts thinking about What is an angiosperm? [part1][part2][why I pondered about it].)

There a three basic options to place a fossil using a phylogenetic tree.
  1. Putting up a morphological matrix, then inferring the tree. A classic but due to the nature of most morphological data sets leading to a partly wrong tree as we demonstrated in some posts here on the Genealogical World of Phylogenetic Networks (hence, such analysis should always be done in a network-based exploratory data analysis framework).
  2. Putting up a mixed molecular-morphological matrix, then inferring a "total evidence" tree. This includes sophisticated approaches that use the molecular data to implement weights on the morphological traits and/or consider the age of the fossils (so-called total evidence dating approaches). Works not that bad with animal-data, provided the matrix includes a lot of morphological traits reflecting aspects of the (molecular-based) phylogeny. Doesn't work too well for plants because we usually have much fewer scorable traits, most of which are evolved convergently or in parallel. Non-trivial plant fossils love to act as rogues during phylogenetic inference.
  3. Optimise the position of a fossil in a molecular-based tree, eg. using so-called "DNA scaffold approach" (usually using parsimony as optimality criterion) or the evolutionary placement algorithm implemented in RAxML (using maximum likelihood). A special form of this approach is to first map the traits on a (dated) molecular tree, and then find the position where a fossil would fit best.

Why (standard) phylogenetic tree-based approaches are tricky

Below a simple example, including three fossils of different age (and often, place) with different character suites.


Even though none of the derived traits (blue and red "1") is a synapomorphy (fide Hennig), we can assign the youngest fossil X to the lineage of genus 1A just based just based on its unique derived ('apomorphic') character suite. Its likely a crown-group fossil of clade 1, and may inform a minimum age for the most-recent common ancestor (MRCA) of the two modern-day genera of Clade 1.
Apomorphy-wise, fossils Y and Z cannot be unambiguously placed. The red trait appears to be independently obtained in both clades, and the blue trait may have been
To discern between the options, we'd be well-advised to do character mapping in a probabilistic framework which require a tree with independently defined branch-lengths.

Just by using parsimony-based DNA-scaffolding, fossil X would be confirmed as crown-group fossil and member of genus 1A (being identical and different from all others) and fossil Z would end up as a stem-group fossil. Fossil Y, however, would be placed as sister to genus 2C (again, identical to each other and different from all others). Using Y in node dating, would then lead to a much too old divergence age for the crown-group age of Clade 2. In reality, what researchers do with such a seemingly too old fossil is not to use it by the book, as MRCA of Genus 2B and 2C, but to inform the MRCA of eg. genera 2A, 2B, and 2C assuming that the fossil's age and trait set indicate the 2C morphology is primitive within the clade or Y is an extinct sister lineage and the shared derived trait a convergence (parallelism).

Four characters, three homoplastic and one invariant, are surely not enough for DNA-scaffolding, but adding more and more characters has a catch. Easy to do for the modern-day taxa, for which we also have molecular data, the preservation of fossils limits adding many more traits; any trait not preserved in the fossil is effectively useless when placing it (including not-preserved traits in total evidence approach may, nonetheless, help the analysis). Which brings us to the real-world example just published in Science:

Wilf P, Nixon KC, Gandolfo MA, Cúneo RA (2019). Eocene Fagaceae from Patagonia and Gondwanan legacy in Asian rainforests. Science 364, 972. Full-text article at Science website.

Why one should not place a fossil using DNA-scaffolding with seven characters

Wilf et al. show (another) spectacularly preserved fossil from the Eocene of Patagonia. Personally, I think that just publishing and shortly describing such a beautiful fossil should be enough to get into the leading biological journals.

But Wilf et al. wanted (needed?) more and came up with the following "phylogenetic analysis" to argue that their fossil is a crown-group Castanoideae, a representative of the modern-day firmly Southeast Asian tropical-subtropical genus Castanopsis, and evidence for a "southern route to Asia hypothesis" (via Antarctica and Australia, both well-studied but devoid so far of any Fagaceae presence; despite the fact that the modern-day climate allows cultivating them as eg. source for commercially used wood).


Wilf et al's Fig. 3 and Table 1 suggest to me that the paper was not critically reviewed by anyone familiar with the molecular genetics of Fagaceae or phylogenetic methods in general — perhaps this is not needed, since the first author is well-merited and the second author a world-leading expert of botanical palaeo-cladistics. However, parsimony-based DNA-scaffolding can be tricky, even with a larger set of characters (see eg. the post on Juglandaceae using a well-done matrix), and using seven is therefore quite bold. Notably, of the seven characters, one is parsimony-uninformative and four are variable within at least one of the included OTUs.

Side note: The tree used as a backbone is outdated and not comprehensive. Plastid and nuclear-molecular data indicate that the castanoids Lithocarpus (mostly tropical SE Asia) and Chrysolepis (temperate N. America) may be sisters. However, the morphologically quite similar Notholithocarpus is not related to either of these, but is instead a close relative of the ubiquitous oaks, genus Quercus (not included in Wilf et al.'s backbone tree), especially subgenus Quercus. Furthermore, the (today Eurasian) castanoid sisterpair Castanea (temperate)-Castanopsis (tropical-subtropical) have stronger affinities to the (today and in the past) Eurasian oaks of subgenus Cerris. The Fagaceae also include three distinct monotypic relict genera, the "trigonobalanoids" Formanodendron and Trigonobalanus, SE Asia, and Colombobalanus from Columbia, South America. Using a more up-to-date instead of a 2-decade-old molecular hypothesis would have been a fair request during review, as would compiling a new molecular matrix to infer a tree used as backbone (currently gene banks include > 238,000 nucleotide DNA accessions including complete plastomes). This would have also enabled the authors to map their traits using a probabilistic framework, which can protect to some degree against homoplastic bias but requires a backbone tree with defined branch-lengths.

There are many more problems with the paper and its conclusions, but this critique would be content- not network-related. Let's just look at the data and see why Wilf et al. would have better off not showing any phylogenetic analysis at all (and the impact-driven editors and positive-meaning reviewers should have advised against it). Or a network.

Clades with little character support

The scaffolding placed the Eocene fossil in a clade with both representatives of Castanopsis, from which it differs by 0–2 and 1–4 traits, respectively. Phylogeny-based, the fossil is a stem- or crown-Castanopsis.

However, the fossil has a character suite that differs in just a single trait (#6: valve deshiscence) from the (genetically very distant) sister taxon of all other Fagaceae, Fagus (the beech), used here as the outgroup to root the Castanoideae subtree. As far as apomorphies are concerned, the data are inconclusive as to whether the fossil represents a stem-Castanoideae (or extinct Fagaceae lineage) or a Castanopsis — this critical, potentially diagnostic derived trait, partial valve dehiscence, is only shared by the fossil and some but not all modern-day Castanopsis. This particular trait is not mentioned elsewhere in the text, although it is the reason the fossil is placed next to Castanopsis and not the outgroup Fagus in the "phylogenetic analysis".

In the following figure, I have mapped (with parsimony) the putative character mutations on the tree used by Wilf et al.

Black font: shared by Fagus (outgroup) and "Castanoideae". Green font: potential uniquely derived traits. Blue font: traits reconstructed as having evolved in parallel/convergently. Red branches, clades in the used backbone tree that are at odds with currently available molecular data (the N. American relict Notholithocarpus should be sister to the Eurasian Castanea-Castanopsis).

This hardly presents a strong case of crown-group assignation. Except for partial dehiscence, even the modern-day Castanopsis have little discriminating derived traits — they are living fossils with a primitive ('plesiomorphic') character suite. Intriguingly, they are also genetically less derived than other Castanoideae and the oaks (see eg. the ITS tree in Denk & Grimm 2010).

The actual differentiation pattern

The best way to depict what the character set provides as information for placing the fossil is, of course, the Neighbor-net, as shown next.

Neighbor-net based on Wilf et al.'s seven scored morphological traits used to place the fossil. Green: the current molecular-based phylogenetic synopsis — based mostly on Oh & Manos 2008; Manos et al. 2008; Denk & Grimm 2010. I had the opportunity to get familiar with all of the then-available genetic data when harvesting all Fagaceae data from gene banks in 2012 for a talk in Bordeaux. One complication in getting an all-Fagaceae-tree is that plastids, geographically constrained, and nuclear regions tell partly different stories.


Castanopsis, including the fossil, is morphologically a paraphyletic (see also our other posts dealing with paraphyla represented as clades in trees). Note also the long edge-bundle separating the temperate Chrysolepis and chestnuts (Castanea), from their respective cold-intolerant sister genera (Lithocarpus viz Castanopsis) — derived traits have been accumulated in parallel within the "Castanoideae". The scored aspects of Fagaceae morphology are very flexible and ~50 million years is a long time, possibly leading to partial valve indehiscence (or losing it) without being part of the same generic lineage. The puzzling differentiation, and the profoundly primitive appearance of the fossil (shared with modern-day Castanopsis), may in fact be the reason the authors didn't: (i) optimize / discuss very similar, co-eval fossils from the Northern Hemisphere interpreted (and cited) as extinct genera (eg. Crepet & Nixon 1989), (ii) left out the two Fagaceae genera today occurring in South America, (iii) opted for classic parsimony and a partly outdated molecular hypothesis, and (iv) just showed a naked cladogram without branch support values as the result of their "phylogenetic analysis" (Please stop using cladograms!)

Based on the scored characters, the position of the fossil in the graph, and on the background of a more up-to-date molecular-based phylogenetic synopsis (the green tree in the figure above), the most parsimonious interpretation (and probably, the most likely) is that the fossil may indeed be a stem-Castanoideae, a representative of the lineage from which the Laurasian oaks evolved at least 55 million yrs ago (oldest Quercus fossil was found in SE Asia), or even represent a morphologically primitive, extinct (South) American lineage of the Fagaceae. Regarding the "southern route", Ockham's Razor would favor that they are just a South American extension of the widespread Eocene Laurasian Fagaceae / Castanoideae, since very similar fossils and castaneoid pollen is found in equally old and older sites in North America, Greenland (papers cited by Wilf et al.) and Eurasia but not Australia, New Zealand or Antarctica.

A final note: when you have so few characters to compare, you should use OTUs that are not completely ambiguous in every potentially discriminating character, as scored for the "C. fissa group" — the "Castanopsis group" has a single unambiguously defined, potentially derived trait. Using artificial bulk taxa is generally a bad idea when mapping trait evolution onto a molecular backbone tree. Instead, you should compile a representative placeholder taxa set, with as many taxa as you need (or are feasible) to represent all character combinations seen in the modern species/genera.


Postscriptum (14/1/2020)
Relevant matrices (NEXUS-formatted) and explicit character trait maps (Why we want to map trait evolution on networks, pt.1 – Introduction, pt.2 – Topological Ambiguity) have been uploaded to figshare.


Other cited references, with comments
Crepet WL, Nixon KC (1989) Earliest megafossil evidence of Fagaceae: phylogenetic and biogeographic implications. American Journal of Botany 76: 842–855. – introducing a Castanopsis-like infructescence interpreted to represent an extinct genus but very similar to the new Patagonian fossil in its preserved features; and co-occuring with castaneoid pollen (not reported so far for Patagonia) and foliage.
 
Denk T, Grimm GW (2010) The oaks of western Eurasia: traditional classifications and evidence from two nuclear markers. Taxon 59: 351–366. — includes an all-"Quercaceae" ITS-tree (fig. 3) and -network (fig. 4) using data of ~ 1000 ITS accessions; the nuclear-encoded ITS is so far the only comprehensively sampled gene region that gets the genera and main intra-generic lineages apart (recently confirmed and refined by NGS phylogenomic data), something wide-sampled plastid barcodes struggle with. Analysed with up-to-date methods and avoiding long-branch interference by excluding the only partially alignable Fagus, Castanopsis dissolves into a grade in the all-accessions tree and Quercus is deeply nested within the Castanoideae (as already seen in the 2001 tree used by Wilf et al. as backbone). The species-level PBC neighbor-net prefers a ciruclar arrangement in which Notholithocarpus remains a putative sister of substantially divergent and diversified Quercus, followed by Castanea-Castanopsis, and Lithocarpus, while Chrysolepis is recognized as unique.

Oh S-H, Manos PS (2008) Molecular phylogenetics and cupule evolution in Fagaceae as inferred from nuclear CRABS CLAW sequences. Taxon 57: 434–451. – Probably still the best Fagaceae tree, and surely not a bad basis for probabilistic mapping of morphological traits in the family.

Manos PS, Cannon CH, Oh S-H (2008) Phylogenetic relationships and taxonomic status of the paleoendemic Fagaceae of Western North America: recognition of a new genus, Notholithocarpus. Madroño 55: 181–190. – the tree failed to resolve the monophyly of the largest genus, the oaks, but depicts well the data reality when combining ITS with plastid data and, hence, provides a good trade-off guide tree.