Monday, February 26, 2018

Tossing coins: linguistic phylogenies and extensive synonymy


The procedures by which linguists sample data when carrying out phylogenetic analyses of languages are sometimes fundamentally different from the methods applied in biology. This is particularly obvious in the matter of the sampling of data for analysis, which I will discuss in this post.

Sampling data in historical linguistics

The reason for the difference is straightforward: while biologists can now sample whole genomes and search across those genomes for shared word families, linguists cannot sample the whole lexicon of several languages. The problem is not that we could not apply cognate detection methods to whole dictionaries. In fact there are recent attempts that try to do exactly this (Arnaud et al. 2017). The problem is that we simply do not know exactly how many words we can find in any given language.

For example, the Duden, a large lexicon of the German language, for example, recently added 5000 more words, mostly due to recent technological innovations, which then lead to new words which we frequently use in German, such as twittern "to tweet", Tablet "tablet computer", or Drohnenangriff "drone attack". In total, it now lists 145,000 words, and the majority of these words has been coined in complex processes involving language-internal derivation of new word forms, but also by a large amount of borrowing, as one can see from the three examples.

One could argue that we should only sample those words which most of the speakers in a given language know, but even there we are far from being able to provide reliable statistics, not to speak of the fact that it is also possible that these numbers vary greatly across different language families and cultural and sociolinguistic backgrounds. Brysbaert et al. (2016), for example, estimate that
an average 20-year-old native speaker of American English knows 42,000 lemmas and 4,200 non-transparent multiword expressions, derived from 11,100 word families.
But in order to count as "near-native" in a certain language, including the ability to pursue studies at a university, the Common European Framework of Reference for Languages, requires only between 4000 and 5000 words (Milton 2010, see also List et al. 2016). How many word families this includes is not clear, and may, again, depend directly on the target language.

Lexicostatistics

When Morris Swadesh (1909-1967) established the discipline of lexicostatistics, which represented the first attempt to approach the problems we face in historical linguistics with the help of quantitative methods. He started from a sample of 215 concepts (Swadesh 1950), which he later reduced to only 100 (Swadesh 1955), because he was afraid that some concepts would often be denoted by words that are borrowed, or that would simply not be expressed by single words in certain language families. Since then, linguists have been trying to refine this list further, either by modifying it (Starostin 1991 added 10 more concepts to Swadesh's list of 100 concepts), or by reducing it even further (Holman et al. 2008 reduced the list to 40 concepts).

While it is not essential how many concepts we use in the end, it is important to understand that we do not start simply by comparing words in our current phylogenetic approaches, but instead we sample parts of the lexicon of our languages with the help of a list of comparative concepts (Haspelmath 2010), which we then consecutively translate into the target languages. This sampling procedure was not necessarily invented by Morris Swadesh, but he was first to establish its broader use, and we have directly inherited this procedure of sampling when applying our phylogenetic methods (see this earlier post for details on lexicostatistics).

Synonymy in linguistic datasets

Having inherited the procedure, we have also inherited its problems, and, unfortunately, there are many problems involved with this sampling procedure. Not only do we have difficulties determining a universal diagnostic test list that could be applied to all languages, we also have considerable problems in standardizing the procedure of translating a comparative concept into the target languages, especially when the concepts are only loosely defined. The concept "to kill", for example, seems to be a rather straightforward example at first sight. In German, however, we have two words that could express this meaning equally well: töten (cognate with English dead) and umbringen (partially cognate with English to bring). In fact, as with all languages in the world, there are many more words for "to kill" in German, but these can easily be filtered out, as they usually are euphemisms, such as eliminieren "to eliminate", or neutralisieren "to neutralize". The words töten and umbringen, however, are extremely difficult to distinguish with respect to their meaning, and speakers often use them interchangeably, depending, perhaps, on register (töten being more formal). But even for me as a native speaker of German, it is incredibly difficult to tell when I use which word.

One solution to making a decision as to which of the words is more basic could be corpus studies. By counting how often and in which situations one term is used in a large corpus of German speech, we might be able to determine which of the two words comes closer to the concept "to kill" (see Starostin 2013 for a very elegant example for the problem of words for "dog" in Chinese). But in most cases where we compile lists of languages, we do not have the necessary corpora.

Furthermore, since corpus studies on competing forms for a given concept are extremely rare in linguistics, we cannot exclude the possibility that the frequency of two words expressing the same concept is in the end the same, and the words just represent a state of equilibrium in which speakers use them interchangeably. Whether we like it or not, we have to accept that there is no general principle to avoid these cases of synymony when compiling our datasets for phylogenetic analyses.

Tossing coins

What should linguists do in such a situation, when they are about to compile the dataset that they want to analyze with the modern phylogenetic methods, in order to reconstruct some eye-catching phylogenetic trees? In the early days of lexicostatistics, scholars recommended being very strict, demanding that only one word in a given language should represent one comparative concept. In cases like German töten and umbringen, they recommended to toss a coin (Gudschinsky 1956), in order to guarantee that the procedure was as objective as possible.

Later on, scholars relaxed the criteria, and just accepted that in a few — hopefully very few — cases there would be more than one word representing a comparative concept in a given language. This principle has not changed with the quantitative turn in historical linguistics. In fact, thanks to the procedure by which cognate sets across concept slots are dichotomized in a second step, scholars who only care for the phylogenetic analyses and not for the real data may easily overlook that the Nexus file from which they try to infer the ancestry of a given language family may list a large amount of synonyms, where the classical scholars simply did not know how to translate one of their diagnostic concepts into the target languages.

Testing the impact of synonymy on phylogenetic reconstruction

The obvious question to ask at this stage is: does this actually matter? Can't we just ignore it and trust that our phylogenetic approaches are sophisticated enough to find the major signals in the data, so that we can just ignore the problem of synonymy in linguistic datasets? In an early study, almost 10 years ago, when I was still a greenhorn in computing, I made an initial study of the problem of extensive synonymy, but it never made it into a publication, since we had to shorten our more general study, of which the synonymy test was only a small part. This study has been online since 2010 (Geisler and List 2010), but is still awaiting publication; and instead of including my quantitative test on the impact of extensive synonymy on phylogenetic reconstruction, we just mentioned the problem briefly.

Given that the problem of extensive synonymy turned up frequently in recent discussions with colleagues working on phylogenetic reconstruction in linguistics, I decided that I should finally close this chapter of my life, and resume the analyses that had been sleeping in my computer for the last 10 years.

The approach is very straightforward. If we want to test whether the choice of translations leaves traces in phylogenetic analyses, we can just take the pioneers of lexicostatistics literally, and conduct a series of coin-tossing experiments. We start from a "normal" dataset that people use in phylogenetic studies. These datasets usually contain a certain amount of synonymy (not extremely many, but it is not surprising to find two, three, or even four translations in the datasets that have been analysed in the recent years). If we now have the computer toss a coin in each situation where only one word should be chosen, we can easily create a large sample of datasets each of which is synonym free. Analysing these datasets and comparing the resulting trees is again straightforward.

I wrote some Python code, based on our LingPy library for computational tasks in historical linguistics (List et al. 2017), and selected four datasets, which are publicly available, for my studies, namely: one Indo-European dataset (Dunn 2012), one Pama-Nyungan dataset (Australian languages, Bowern and Atkinson 2012), one Austronesian dataset (Greenhill et al. 2008), and one Austro-Asiatic dataset (Sidwell 2015). The following table lists some basic information about the number of concepts, languages, and the average synonymy, i.e., the average number of words that a concept expresses in the data.

Dataset Concepts Languages Synonymy
Austro-Asiatic 200 58 1.08
Austronesian 210 45 1.12
Indo-European 208 58 1.16
Pama-Nyungan 183 67 1.1

For each dataset, I made 1000 coin-tossing trials, in which I randomly picked only one word where more than one word would have been given as the translation of a given concept in a given language. I then computed a phylogeny of each newly created dataset with the help of the Neighbor-joining algorithm on the distance matrix of shared cognates (Saitou and Nei 1987). In order to compare the trees, I employed the general Robinson-Foulds distance, as implemented in LingPy by Taraka Rama. Since I did not have time to wait to compare all 1000 trees against each other (as this takes a long time when computing the analyses for four datasets), I randomly sampled 1000 tree pairs. It is, however, easy to repeat the results and compute the distances for all tree pairs exhaustively. The code and the data that I used can be found online at GitHub (github.com/lingpy/toss-a-coin).

Some results

As shown in the following table, where I added the averaged generalized Robinson-Foulds distances for the pairwise tree comparisons, it becomes obvious that — at least for distance-based phylogenetic calculations — the problem of extensive synonymy and choice of translational equivalents has an immediate impact on phylogenetic reconstruction. In fact, the average differences reported here are higher than the ones we find when comparing phylogenetic reconstruction based on automatic pipelines with phylogenetic reconstruction based on manual annotation (Jäger 2013).

Dataset Concepts Languages Synonymy Average GRF
Austro-Asiatic 200 58 1.08 0.20
Austronesian 210 45 1.12 0.19
Indo-European 208 58 1.16 0.59
Pama-Nyungan 183 67 1.1 0.22

The most impressive example is for the Indo-European dataset, where we have an incredible average distance of 0.59. This result almost seems surreal, and at first I thought that it was my lazy sampling procedure that introduced the bias. But a second trial confirmed the distance (0.62), and when comparing each of the 1000 trial trees with the tree we receive when not excluding the synonyms, the distance
is even slightly higher (0.64).

When looking at the consensus network of the 1000 trees (created with SplitsTree4, Huson et al. 2006), using no threshold (to make sure that the full variation could be traced), and the mean for the calculation of the branch lengths, which is shown below, we can see that the variation introduced by the synonyms is indeed real.


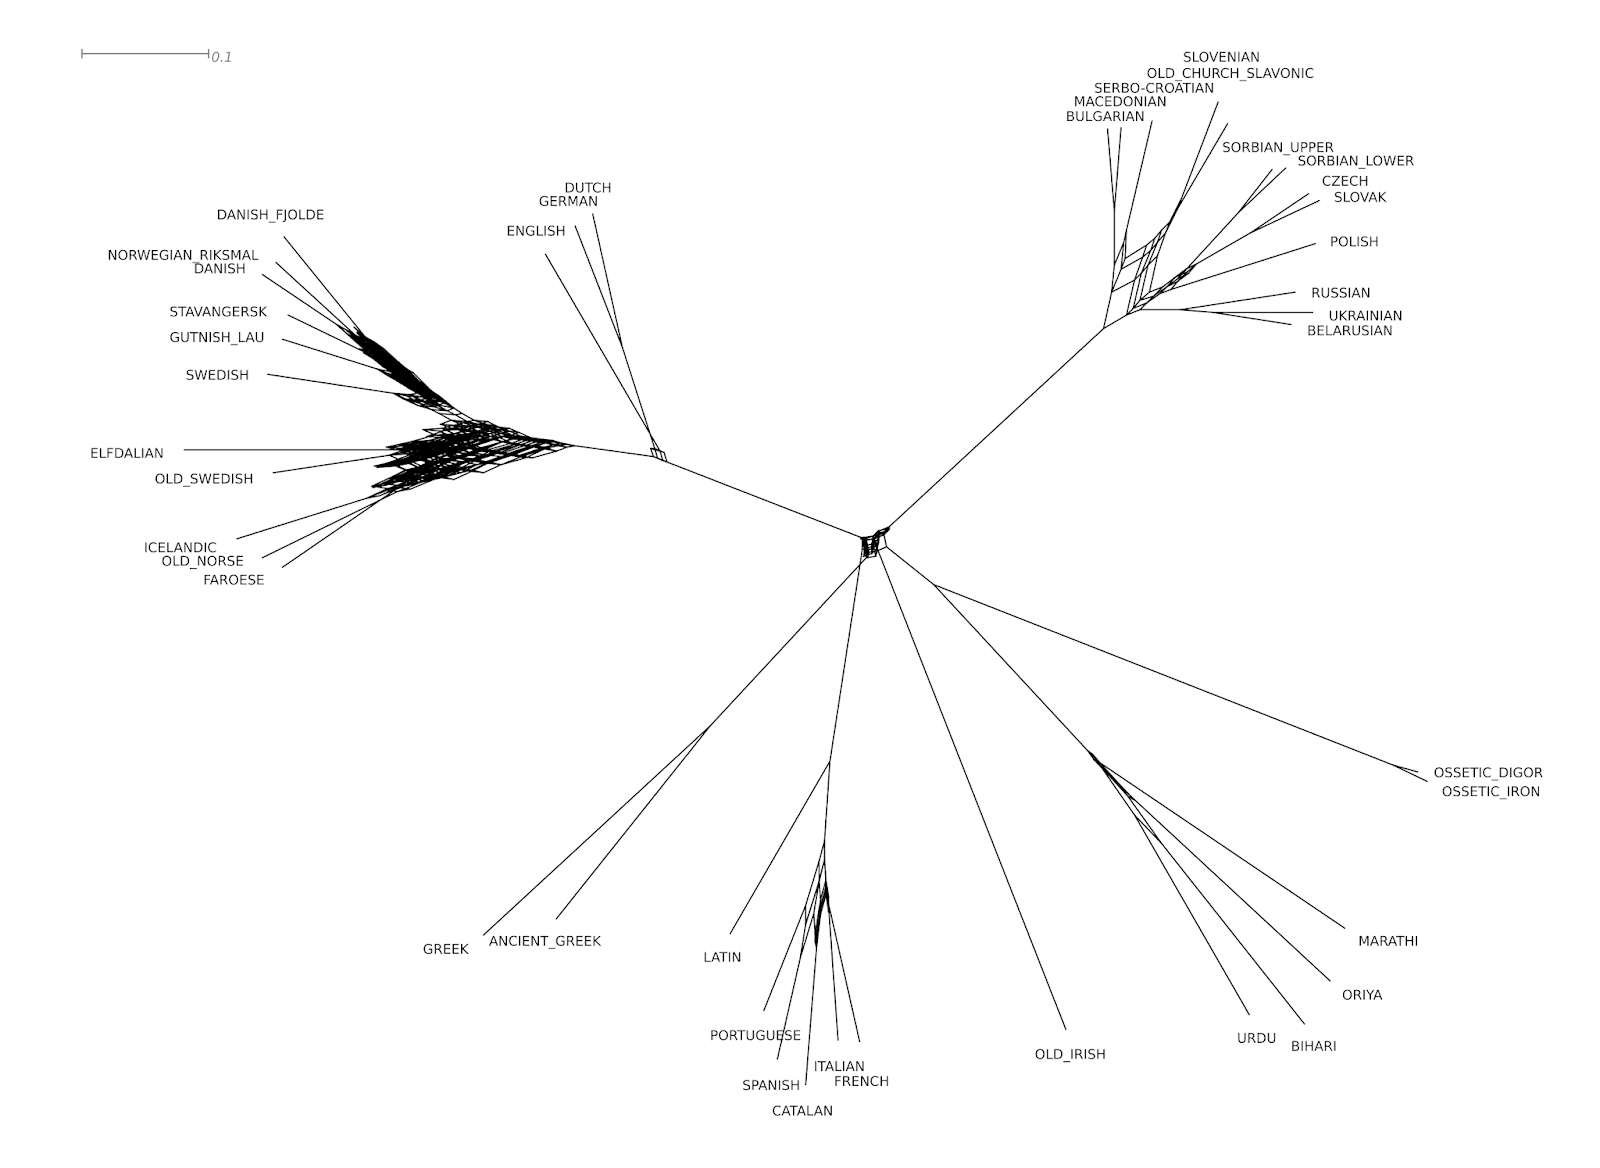
The consensus network of the 1000 tree sample for the Indo-European language sample

Notably, the Germanic languages are highly incompatible, followed by Slavic and Romance. In addition, we find quite a lot of variation in the root. Furthermore, when looking the at the table below, which shows the ten languages that have the largest number of synonyms in the Indo-European data, we can see that most of them belong to the highly incompatible Germanic branch.

Language Subgroup Synonymous Concepts
OLD_NORSE Germanic 83
FAROESE Germanic 77
SWEDISH Germanic 68
OLD_SWEDISH Germanic 65
ICELANDIC Germanic 64
OLD_IRISH Celtic 61
NORWEGIAN_RIKSMAL Germanic 54
GUTNISH_LAU Germanic 50
ORIYA Indo-Aryan 50
ANCIENT_GREEK Greek 46

Conclusion

This study should be taken with some due care, as it is a preliminary experiment, and I have only tested it on four datasets, using a rather rough procedure of sampling the distances. It is perfectly possible that Bayesian methods (as they are "traditionally" used for phylogenetic analyses in historical linguistics now) can deal with this problem much better than distance-based approaches. It is also clear that by sampling the trees in a more rigorous manner (eg. by setting a threshold to include only those splits which occur frequently enough), the network will look much more tree like.

However, even if it turns out that the results are exaggerating the situation due to some theoretical or practical errors in my experiment, I think that we can no longer ignore the impact that our data decisions have on the phylogenies we produce. I hope that this preliminary study can eventually lead to some fruitful discussions in our field that may help us to improve our standards of data annotation.

I should also make it clear that this is in part already happening. Our colleagues from Moscow State University (lead by George Starostin in the form of the Global Lexicostatistical Database project) try very hard to improve the procedure by which translational equivalents are selected for the languages they investigate. The same applies to colleagues from our department in Jena who are working on an ambitious database for the Indo-European languages.

In addition to linguists trying to improve the way they sample their data, however, I hope that our computational experts could also begin to take the problem of data sampling in historical linguistics more seriously. A phylogenetic analysis does not start with a Nexus file. Especially in historical linguistics, where we often have very detailed accounts of individual word histories (derived from our qualitative methods), we need to work harder to integrate software solutions and qualitative studies.

References

Arnaud, A., D. Beck, and G. Kondrak (2017) Identifying cognate sets across dictionaries of related languages. In: Proceedings of the 2017 Conference on Empirical Methods in Natural Language Processing 2509-2518.

Bowern, C. and Q. Atkinson (2012) Computational phylogenetics of the internal structure of Pama-Nguyan. Language 88. 817-845.

Brysbaert, M., M. Stevens, P. Mandera, and E. Keuleers (2016) How many words do we know? Practical estimates of vocabulary size dependent on word definition, the degree of language input and the participant’s age. Frontiers in Psychology 7. 1116.

Dunn, M. (ed.) (2012) Indo-European Lexical Cognacy Database (IELex). http://ielex.mpi.nl/.

Geisler, H. and J.-M. List (2010) Beautiful trees on unstable ground: notes on the data problem in lexicostatistics. In: Hettrich, H. (ed.) Die Ausbreitung des Indogermanischen. Thesen aus Sprachwissenschaft, Archäologie und Genetik. Reichert: Wiesbaden.

Greenhill, S., R. Blust, and R. Gray (2008) The Austronesian Basic Vocabulary Database: From bioinformatics to lexomics. Evolutionary Bioinformatics 4. 271-283.

Gudschinsky, S. (1956) The ABC’s of lexicostatistics (glottochronology). Word 12.2. 175-210.

Haspelmath, M. (2010) Comparative concepts and descriptive categories. Language 86.3. 663-687.

Holman, E., S. Wichmann, C. Brown, V. Velupillai, A. Müller, and D. Bakker (2008) Explorations in automated lexicostatistics. Folia Linguistica 20.3. 116-121.

Huson, D. and D. Bryant (2006) Application of phylogenetic networks in evolutionary studies. Molecular Biology and Evolution 23.2. 254-267.

Jäger, G. (2013) Phylogenetic inference from word lists using weighted alignment with empirical determined weights. Language Dynamics and Change 3.2. 245-291.

List, J.-M., J. Pathmanathan, P. Lopez, and E. Bapteste (2016) Unity and disunity in evolutionary sciences: process-based analogies open common research avenues for biology and linguistics. Biology Direct 11.39. 1-17.

List, J.-M., S. Greenhill, and R. Forkel (2017) LingPy. A Python Library For Quantitative Tasks in Historical Linguistics. Software Package. Version 2.6. Max Planck Institute for the Science of Human History: Jena.

Milton, J. (2010) The development of vocabulary breadth across the CEFR levels: a common basis for the elaboration of language syllabuses, curriculum guidelines, examinations, and textbooks across Europe. In: Bartning, I., M. Martin, and I. Vedder (eds.) Communicative Proficiency and Linguistic Development: Intersections Between SLA and Language Testing Research. Eurosla: York. 211-232.

Saitou, N. and M. Nei (1987) The neighbor-joining method: a new method for reconstructing phylogenetic trees. Molecular Biology and Evolution 4.4. 406-425.

Sidwell, P. (2015) Austroasiatic Dataset for Phylogenetic Analysis: 2015 version. Mon-Khmer Studies (Notes, Reviews, Data-Papers) 44. lxviii-ccclvii.

Starostin, S. (1991) Altajskaja problema i proischo\vzdenije japonskogo jazyka [The Altaic problem and the origin of the Japanese language]. Nauka: Moscow.

Starostin, G. (2013) K probleme dvuch sobak v klassi\cceskom kitajskom jazyke: canis comestibilis vs. canis venaticus? [On the problem of two words for dog in Classical Chinese: edible vs. hunting dog?]. In: Grincer, N., M. Rusanov, L. Kogan, G. Starostin, and N. \cCalisova (eds.) Institutionis conditori: Ilje Sergejevi\ccu Smirnovy.[In honor of Ilja Sergejevi\cc Smirnov].L. RGGU: Moscow. 269-283.

Swadesh, M. (1950) Salish internal relationships. International Journal of American Linguistics 16.4. 157-167.

Swadesh, M. (1955) Towards greater accuracy in lexicostatistic dating. International Journal of American Linguistics 21.2. 121-137.

Monday, February 19, 2018

We want to publish our phylogenetic data – including networks, but where?


(This is a joint post by Guido Grimm and David Morrison)

About five years ago, David wrote two posts regarding issues with the public availability and release of phylogenetic data. Since then, the situation has become a bit more beneficial for science, but we still have not progressed as far as we should have. In this post, we will share some anecdotes , and give some tips for where you can do store your networks.

David asked an interesting question: Why are phylogeneticists so reluctant to present their actual data in the first place? In this schematic, this asks why the arrow connecting "Data Product" to "Reality" is so often missing.


The archiving of primary data (the data matrix) and its derivatives (eg. phylogenies) should be obligatory, so that the basic data are publicly available, so that the results can be verified by others, and any errors identified / eliminated.

There is no good reason to hold it back. While we may have put a lot of effort into our data sets, if we don't share them then this effort will only benefit ourselves, and it will become null and void after we have published our paper. We also may leave science (via retirement or something else), or otherwise stop maintaining our professional homepage, and at this point our data legacy will likely drift off in a puff of smoke.

On the other hand, when we make the data publicly available, others can take it from there. Indeed, we may even meet new collaborators, if they are interested in the same line of research. Just as importantly, we are no longer responsible for keeping it at hand for eventual requests. This is one of the chief advantages of sites like ResearchGate, which automate this sort of administrative effort.

If the re-users of our data are honest scientists, then they will (of course) cite us for our data matrix. But if they have to sit down to harvest the genebanks, and re-create the matrix from scratch, then why should they cite the people that produced the data? More importantly, making data sets accessible enables teachers / lectures to make use of it in their courses, having at hand one (or more, when the data were re-used) publications for discussion.

It also gives developers some test datasets for new algorithms and programs. For instance, Guido's best-cited (first-author) paper on GoogleScholar (Grimm et al. Evolutionary Bioinformatics 2006) has been cited 66 times (per February 13th), mainly because the maple dataset has become a tricky test set for a large amount of bioinformatic papers passed from one bioinformatician to the other. It is for this reason that our compilation of verified empirical network datasets was first created.

Finally, for most of us our research is made possible by public money, so we do not actually own our data, personally. It really belongs to the public, who funded it, so there should be public access to it — we cannot monopolize expertise that is created by public funding.

As an aside, it avoids responses such as these (all of which are real, and quite common):
I cannot send you the data because I don't have a backup on my new computer
I don't have the data, only the late Ph.D. student has it, who has left the lab
I can't find the data, because I have changed universities
I'm not sure if I can share the data, as it was a collaborative project
I expect to be a co-author, even if I do no further work.

Tides have turned, somewhat

There are quite a few journals that now expect that each phylogenetic data matrix, and the inferred tree, is stored within a public repository. For instance, BioMed Central journals such as BMC Evolutionary Biology (now owned by Springer-Nature), expect you store your (phylogenetic) data in a public repository such as TreeBase or Dryad. However, few journals enforce the documentation of primary data (e.g. Nature, the same publisher's flagship journal, does not), but treat it only as a recommendation. The easiest way to enforce the archiving is to refuse to review any manuscript where the data has not already been deposited.

TreeBase, which is free of charge, is still only an option when you deal with simple data: a matrix and a tree, or a few trees inferred from the matrix — network-formatted genealogies cannot be stored, only trees. When you have networks, a compilation of analysis files, trees including labels that are not referring to species (in a taxonomic sense), it is not an option. For example, the TreeBase submission of the above-mentioned maple data is defunct, because the maximum likelihood trees were based on individual clones or consensus sequences. The main result, "bipartition networks" based on the ML bootstrap pseudoreplicate samples, cannot be handled; and naked matrices are not published anymore (you need a tree to go with the matrix).

Dryad has no file type or content limitations, but it charges a fee (although quite modest). A few of the journals enforcing data storage such as Systematic Biology cover the cost, but Springer-Nature's BMC Evolutionary Biology does not — with respect for what they charge for a publication (> $2,500), they should. Springer-Nature has now launched an open research initiative with open data components (eg. LOD), of its own, but so far little has changed (see eg. the fresh paper on Citrus in Nature); and it would be surprising that making data openly accessible would come with no extra costs for the authors.

Ideally, there would be as online supplement

Providing the data as an open-access online supplement directly linked to the paper seems to be a natural choice. Everyone that finds the paper can then directly access the related data and main analysis files.

Journals such as PeerJ, or the Public Library of Science (PLoS) series, make it possible to upload a wide range of file formats as online supplements. While most journals now have online supplements, relatively few allow uploading of, for example, a packed (zipped) archive file. This is the only possible option when you want to not only provide the raw NEXUS file and a NEWICK-formatted text file with the tree, but also e.g. the bootstrap samples or the Bayesian sampled topology file and the support consensus networks based on them. This requires an annotated (graphically enhanced) Split-NEXUS file generated with SplitsTree, or a fully annotated matrix, or the outcome of a median network analysis from the NETWORK program. There is usually some limitation on the maximum size (storage space generates real costs for the publisher).

A nice touch of PeerJ is that each supplement file gets it's own DOI, similar to Dryad's annotation procedure, making the uploaded data archives/files individually referencable.


More alternatives

Most, if not all, journals with good online supplement storages are open access journals, where you have to pay to publish — currently a bit over 1000 $ for PeerJ; and ~ 1500 $ for e.g. PLoS ONE (PeerJ also has the option of individual life-long publishing plans). Perhaps a basic problem with open access is that it moves the financial cost from the reader to the writer — this is not good if you have little funding to do your work.

So what do you do when you publish in a traditional journal with few online storage options?

One alternative is Figshare, where you have up to 20 GB storage for free, and can upload a variety of file types, including images, spreadsheets, and data archives. Uploading images and data to repositories like Dryad or figshare may also be a good option where restrictive copyright clauses still occasionally are found in publication agreements. Before submitting the final version, you simply publish the data and figures there under a CC-BY licence, and reference them accordingly in your copyrighted book chapter or paper.

And increasing number of institutions now also provide the possibility to store (permanently) research data produced at the institution. So, it's always worth asking the IT-department or the university biobliotheque about the availability of such an option. And some countries such as Austria have launched their own open data platforms.

Uploading data files to ResearchGate is probably not an option for network-affine research, as it allow only PDF files (they then need to be text-extractable). As phylogeneticists, we want to distribute our (usually NEXUS-, FASTA- or PHYLIP-formatted) matrices and primary inference-results file, so that they become part of the scientific world.

There is also the possibility of generic cloud storage, which is often free, or at least available to users of certain operating systems or programs. Unfortunately, this is entirely a short-term option, no different from a personal home page; and it may be a target for hackers, anyway.


Final comment

One frequently raised issue not mentioned so far is the concept of a gray area of social or personal responsibility. That is, there might be unforeseen or undesirable consequences to a general obligation to provide full documentation of primary data. This is always an issue in the medical and social sciences, for example, where the exposure of personal data might lead to societal problems. Even in palaeontology, there may be legitimate concerns about, for example, making the GPS coordinates of special fossil sites publicly available.

However, there is nothing to stop an author highlighting such issues at the time of their manuscript submission, and the editor asking for comments from the reviewers, who are supposed to be experts in the particular field.

Some further relevant links (please feel free to point out more)

Join the discussion by using our comments below; or provide your answer to the open question at the PeerJ Questions portal: Should we be forced to publish primary data integral to our results?

Twitter has the hashtag #OpenData, used by people / organisations promoting or providing open data, as well as those who are (so far) only allegedly dedicated to it (such as Springer-Nature and RELX-Elsevier).

The open source software environment RStudio for R allows knitting and publishing html-files (and other file formats) on their RPubs server, which can be a convenient way to permanently store your R-obtained results and scripts (e.g. Potts & Grimm, 2017).

Preprint servers such as arXiv, bioRxiv, and PeerJ Preprints also provide the option to attach supplementary data files (there are usually size limits), using a wide range of file formats including zipped archives. arXiv had to end its data storage programme in 2013, but still accepts "ancillary files" for raw data, code, etc. "up to a few MB" (which should be enough for a phylogenetic data matrix).

For Austrian/German-speaking users, as noted above, there is Austria's new Open Data Portal (ODP). So far, German is the only language selectable from the scroll-down menu, but there seem to be no registering restrictions.

Monday, February 12, 2018

Tree metaphors and mathematical trees


We have had quite a few blog posts about the early metaphors used for genealogical (and other) relationships, whether they be for biology, linguistics or stemmatology. These early metaphors tended to be about trees, either in a literal sense or as a stick diagram of some sort, although we have tried to cover all of the early genealogical networks, as well.

One of Haeckel's oaks

However, this situation does create some potential confusion, because the concept of a genealogical (or phylogentic) tree in the modern world is very much based on the mathematical concept of a tree, which is a graph-theoretical construction. This was clearly not the intention of most of the early authors, especially those writing before Arthur Cayley introduced the mathematical concept (in 1857).

The mathematical version of a tree is a line graph, in which nodes are connected by edges. The edges must be directed if the graph is to represent evolutionary history (ie. the edges point away from the root); and it must be acyclic (or else a descendant could be its own ancestor). The leaf nodes are usually (observed) contemporary taxa, and the internal nodes are (inferred) ancestors. Note that this definition can be applied to both bifurcating trees and to reticulating networks.

This construction is valuable for computational purposes, because we can construct a mathematically optimal tree, which biologists can then use as a starting point for representing the hypothesized genealogy. However, it is not necessarily valuable as a metaphor, which was the purpose of most of the early authors.

There is thus a potential difficulty for modern reads to interpret the older diagrams; and it seems likely, in turn, that the authors of many of the older diagrams would be somewhat befuddled by the modern mathematical restrictions. Sometimes the metaphor and the mathematics will agree, and sometimes they won't.

Branching silhouettes

This issue has been addressed by János Podani in two complementary papers:
  • Tree thinking, time and topology: comments on the interpretation of tree diagrams in evolutionary / phylogenetic systematics. Cladistics 29: 315-327 (2013).
  • Different from trees, more than metaphors: branching silhouettes — corals, cacti, and the oaks. Systematic Biology 66: 737-753 (2017).
He calls the tree metaphors "branching silhouettes", to distinguish them from the mathematical trees. His basic point is this:
There has long been ambiguity in the use of the term tree in phylogenetic systematics, which is a continuous source of misinterpretation of evolutionary relationships. The basic problem is that while many trees with phylogenetic or evolutionary relevance ... are consistent with graph theory, tree-like visualization of phylogeny may also be done via other types of graphics, especially botanical (or literal) tree drawings. As a consequence, the meaning of such diagrams is not always clear: a given picture may have multiple interpretations in its different parts, and two figures that look similar may actually carry quite different information.
Podani resolves the ambiguity by recognizing two fundamental characteristics that any tree diagram will contain: (1) it may show either ancestor-descendant relationships or sister-group relationships; and (2) a time order may be important or it may be disregarded. This leads to a 2x2 representation illustrating the four basic types of "trees" that have been used in phylogenetics.

Podani's tree-metaphor classification

He gives the four types of branching silhouettes tongue-twisting, but appropriate, names.

The diachronous diagrams are "classic" evolutionary trees with a time dimension, which thus have ancestors as internal nodes and contemporary organisms as the leaves. The achronous diagrams are similar, but they allow descendants to arise from contemporary taxa — they are thus the classic "grade" trees showing morphological advancement, which thus allow paraphyletic ancestral groups. The synchronous diagrams are the modern cladograms, with no observed ancestors (but maybe inferred ones at the internal nodes). The asynchronous diagrams are similar, but they can have ancestors as leaves (eg. "pattern" cladograms of ancestors and descendants together).

Podani also gives these four branching silhouettes colloquial names. Charles Darwin is often credited with the tree metaphor, but in the Origin of Species he explicitly acknowledges predecessors, although he does not actually name them (see Naudin, Wallace and Darwin — the tree idea). In his own notebooks, his first metaphor is actually a coral (see Charles Darwin's unpublished tree sketches), and this is the name that Podani recommends for the classic evolutionary trees.

He names the grade trees as cactus, named after the common epithet for the diagram used by Charles Bessey (in 1915) to illustrate plant relationships (see the image below). Furthermore, he recommends oak for the two variants of cladograms, as this is a common epithet for some of the diagrams drawn by Ernst Haeckel (see Who published the first phylogenetic tree?, plus the diagram at the top of this post).

Bessey's cactus

Finally, Podani's work does raise an interesting question. Modern (cladistic) methods of phylogenetics are designed to work with synchronous trees (ie. no observed ancestors). To what extent do these methods work if you try to put fossils into the dataset, which are potential ancestors? After all, this would make the result an asynchronous tree, instead of a synchronous one.

Monday, February 5, 2018

All solved a decade ago: the asterisk branch in the Fagales phylogeny


Application of networks should long have been standard in molecular phylogenetics, to get the most out of the available data. However, you will rarely find one in a systematic botanical paper, at low- or high-hierarchical levels. Instead, the focus of systematic botanical research is to just leave branches with ambiguous support aside until somebody puts together the resources to generate phylogenomic data allowing to infer a fully resolved tree.

It therefore is an interesting exercise to take some systematic research and to look at what networks reveal. To this end, using Stevens' (2001 onwards) brilliant webpage, the Angiosperm Phylogeny Website, I will pick some of the low-supported branches, and show what networks could have revealed (in some cases, long ago)

Stevens essentially collects all of the literature on the various taxonomic groups of angiosperms, making it probably by far the best resource to start with when looking into an angiosperm group. He also provides synoptical trees (permanently updated when new evidence comes up) for the angiosperms at a whole, and their sublineages down to the order level, and annotates the level of support for the branches using generalized categories. My first example (personal interest due to my former research) will be the Fagales.

Fagales

Here's Stevens' overview tree (Fig. 1) for this economically very important order.

Fig. 1 A phylogenetic synopsis for the order Fagales (Stevens 2001 onwards). Except for the asterisk branch, this topology is consensual among any study including representatives of the families of the Fagales.

It's a rather small order with just 7–8 families, interfamily relationships "... are fairly well resolved, although the position of Myricaceae remains uncertain", as it has been for more than a decade. The topology in Fig. 1 is the one found by Li et al. (2004), who wrote in their abstract:
Nucleotide sequences of six regions from three plant genomes — trnL-F, matK, rbcL, atpB (plastid), matR (mtDNA), and 18S rDNA (nuclear) — were used to analyze inter- and infrafamilial relationships of Fagales. All 31 extant genera representing eight families of the order were sampled. Congruence among data sets was assessed using the partition homogeneity test, and five different combined data sets were analyzed using maximum parsimony and the Bayesian approach. At the familial level, the same phylogenetic relationships were inferred from five different analyses of these data. Nothofagus, followed by Fagaceae, are subsequent sisters to the rest of the order. Fagaceae are then sister to the core ‘‘higher’’ hamamelids, which consist of two main subclades, one being Myricaceae (Rhoipteleaceae (Juglandaceae)) and the other Casuarinaceae (Ticodendraceae (Betulaceae)). The combined data sets provide the best-supported estimate of evolutionary relationships within Fagales. Our results suggest that the combination of different sequences from several species within the same genus representing a terminal taxon has little influence on phylogenetic accuracy. Inclusion of taxa with some missing data in combined data sets also does not have a major impact on the topology.
All solved, it seems. The interesting thing is that the only branch with moderate support relates to those families that have the oldest record. Myricaceae and Juglandaceae pollen types can be found deep into the Late Cretaceous, often classified under the form taxon Normapolles, which also includes pollen morphs of uncertain relationship to modern-day Fagales. Myricaceae and Juglandaceae are short-rooted, in contrast to the two first-diverging families, the enigmatic southern hemispheric Nothofagaceae, the false beech, and the (mostly) northern hemispheric Fagaceae, including the trees every European and American knows: the beech trees and oaks. Without these trees, Brittania would have never ruled the waves — especially widespread oaks provide excellent ship wood.

The basic situation: treelike and non-treelike parts

Li et al. (2004) did not show a phylogram, which is still a standard in systematic botany. The "asterisk" branch may just relate to little discriminative signal. Regarding the root, we always should be cautious regarding ingroup-outgroup long-branch attraction. Molecular data has an inherent dilemma. A group diverging first, and earlier than all others (here: Nothofagaceae), should be genetically most distinct. But a later-diverging but fast-evolving group may be more distinct, and hence attracted to the outgroup, which (naturally) may be very distinct from the ingroup.

We don't need to make a full tree-analysis to become aware of the primary signal issues in Li et al.'s data set, a simple neighbour-net will do (Fig. 2).

Fig. 2 Neighbour-net based on simple (Hamming) p-distances inferred from Li et al.'s matrix. Alternative roots refer to the 18S rDNA-inferred root and earliest fossil evidence for discrete Fagales lineages.

From the neighbour-net we can see:
  1. Rhoiptelea, the only member (1-2 species) of the Rhoipteleaceae is much closer to the Juglandaceae than the beeches (Fagus) are to the remainder of its family ("quercoids" within Fagaceae). Interestingly, is has been suggested to include the Rhoipteleaceae as a subfamily within the Juglandaceae, but no-one has come forward with the idea of splitting the Fagaceae.
  2. We also see that the ambiguous support for the Juglandaceae (s.l.) + Myricaceae clade is indeed due to a lack of straightforwardly discriminating signal.
  3. The outgroup-root may be problematic. The Nothofagaceae are most distinct within the order, with little affinity to any other main group. The neighbour-net is a distance-based analysis, and as such vulnerable to long-branching artefacts. Conspicuously, we have an edge bundle pulling one outgroup taxon closer to the equally distinct Fagaceae. But it's impossible to judge whether the outgroup-inferred root is an artefact or not — any outgroup sample (no matter how comprehensive) will enforce the split between the unique Nothofagaceae and the remaining Fagales, and the second-most distinct Fagaceae and the rest.
We also can be sure that any dating approach will be quite difficult using this data set, as most of the genera have a more or less equally old fossil record, contrasting the primary genetic divergence patterns.

The signal issues apparent from the neighbour-net find a reflection in the maximum likelihood bootstrap consensus network (Fig. 3).

Fig. 3 ML-bootstrap consensus network, based on a partitioned analysis (no cut-off); same data than used for Fig. 2. Note that the moderate support for the Myricaceae-Juglandaceae sister relationship (BS = 62, blue) has only one alternative realized in all other BS (pseudo-)replicates (BS = 38, red; 62+38 = 100).

Now, we know that although there is little discriminating signal, the data is decisive about what to do with the Myricaceae — their position is not "uncertain", but instead there are two alternatives: two-thirds of the segregating sites find that they are sister to the Juglandaceae (s.l.), and the other third place them as sister to the BTC clade including Betulaceae, Ticodendraceae and Casuarinaceae.

From an evolutionary point of view, such a situation is easily explained. The splits between the first ancestors of either clade may have been temporally very close, and affected by incomplete lineage sorting, leading to competing signals. Different evolutionary rates in the BTC and Juglandaceae stem lineages compared to that of the Myricaceae would have made BTC and Juglandaceae distinct from each other, but not from the Myricaceae. Another thing may be that the first Myricaceae was geographically closer to the first Juglandaceae than to the first BTC, so that their plastids were more similar (BS = 62)., even though the evolutionary sequence was: Juglandaceae diverge first, then BTC and Myricaceae splits up (BS = 38, mainly supported by the biparentally inherited 18S rDNA).

Let's check these hypotheses.

Three genomes with four different signals

Li et al., and all studies done afterwards, were sure that there are no issues with incongruence. However, they overlooked the imbalance in gene sampling, and the insufficiency of classic tests to uncover actual incongruence. Furthermore, there is no guarantee for compatible data even when the maternal and paternal genealogies (the true trees) are congruent. Different gene regions may reflect certain aspects of the true tree very well, and mess-up others. This is clearly the case for Li et al.'s data set, as evidenced in their Betulaceae subtree. All of the branches have unambiguous support (Fig. 3), but they are wrong when compared to densely sampled data sets using gene regions with more differentiation potential, close to the leaves of the Fagales tree ("actual Betulaceae subtree" indicated in Fig. 3; cf. Grimm & Renner 2013).

The authors used three coding and one non-coding plastid region, adding one mitochondrial gene (matR) and one nuclear-encoded ribosomal gene, the 18S rDNA, a gene region that had long be known to be sequentially very conservative (thus, easy to sequence). Plastid and mitochondrial signatures are maternally inherited in most plants and all flowering plants (angiosperms) as far as studied; the 18S rDNA is part of a tandemly repeated coding unit, the 35S rDNA cistron, inherited from the paternal and maternal side.

Let's assume that
  • all genes contribute equally to the amount of segregating sides, but
  • the plastid and mitochondrial regions prefer one topological alternative (A), and the 18S rDNA, being biparentally inherited, prefers another (B).
In such a case, the maternally inherited gene regions would provide a non-parametric bootstrap support of >80 for topology A when the combined data is used, and <20 for topology B, reflecting the proportion of plastid / mitochondrial regions (5 out of 6).

Any support <<100 (or PP <1.0) may be an indication of incompatible signals and, potentially, conflict. Thus, the only valid test for congruence is to infer single-gene (single-partition) trees, or at least single-genome trees, and then assess whether there are conflicting branches with high support.

Fig. 4 shows the single-gene trees that can be inferred from Li et al.'s matrix, revealing some significant (well-supported, BS > 80) topological incongruence.

Fig. 4 Single-gene trees for Li et al.'s data set. A. 18S rDNA. B. atpB (plastid gene). C. matK (plastid gene), powerful marker providing phylogenetic backbones in essetially all angiosperm studies above the genus level; can outcompete any conflicing signal from other regions. D. matR; the only mitochondrial gene known for a large range of angiosperms, typically with very little discriminative power, reflected here by overall poor support. E. rbcL (plastid gene), the classic angiosperm marker, provides very stable, relatively deep backbones signals. F. trnL intron and trnL-trnF intergenic spacer, best-sampled (to this day) non-coding plastid gene region; alignment can be tricky beyond family and order level, but typically conserved within families and genera (reason for non-100% barcoding success; closely related genera will usually only differ by few, typically convergent and not rarely stochastically distributed point mutations and indel patterns).

With respect to the signal issues seen in the networks based on the combined data, each of the single-gene trees, and their phylogenetic prospects and pitfalls, could be discussed. However, I will only highlight some striking aspects here.
  • Including matR data to cover "all three genomes" is scientific sham. The region does not provide any useful signal (note the low support in Fig. 4D). For the Fagales, it fails miserably to even find unambiguous, long-known groups. And this probably holds for most other datasets that include this region (see this post on networks helping to identify biased roots). If it has any use at all, it's for very deep splits (the Fagales crown-group radiation goes back at least 80 Ma) or groups with extremely inflated mutation rates. But bewareof  the difference between 1st/2nd and 3rd codon position, as the latter shows a lot of stochasticity. With respect to the diffuse signal from this region, it may even be hurtful to include (in particular, when using non-probabilistic inference methods).
  • The split support regarding the Myricaceae is indeed due to incongruent nuclear (biparentally) and plastid signals. But it's contrary to the theory that the plastids out-compete the single nuclear gene — the 18S rDNA out-competes partly or fully incongruent signals from the plastid genes! By adding a plastid gene, we only reduce the near-unambiguous (BS = 97, a lot for a single gene) support for a Myricaceae-Juglandaceae clade. It is, however, not enough to bias the situation entirely, because the conserved plastid genes (atpB, rbcL; Fig. 4B, E) provide somewhat diffuse signals. For instance, the atpB-BS = 38 for the Myricaceae as sister to Juglandaceae and BTC clade competes with the 18S-preferred alternative, and the one preferred by the more variable matK plus the non-coding trnL/LF. The rbcL signal does not help too much the matK–trnL/LF case, because it messes up the ingroup by placing the Fagaceae deep within the core clade.
  • The nuclear gene prefers a different root. We have a BS = 89 (all other alternatives BS < 5) for a clade comprising all cupuliferous, mostly extratropical Fagales: the southern hemispheric Nothofagaceae and the (mostly) northern hemispheric Fagaceae. Note the comparatively low root-tip distance for Nothofagus in case of the 18S rDNA compared to other Fagales (Fig. 4). This is a signal that is completely wiped out in the combined data (Fig. 3), as all of the other regions provide a near-unambiguous (BS > 90) support for a Nothofagus + outgroup vs. the remaining Fagales split.

Returning to our evolutionary hypothesis, Li et al.'s data (properly analysed) indicates that the slow-evolving (or slower) Myricaceae originated geographically close to the common ancestor of the BTC clade, but at the same time were evolutionarily closer to the Juglandaceae. It is important to keep in mind that back then, in the Late Cretaceous (or earlier), when all three families evolved, any then-existing systematicists would probably have recognised all three ancestors and their precursors as species of the same genus, or at least genera of the same family. This follows the example of modern-day Fagaceae and Nothofagaceae, where the plastids are geographically strongly constrained and largely decoupled from morphology (taxonomy) and nuclear genealogies.

Alternative topologies can be evolutionary clues

The data of Li et al. (2004) may appear to be quite old, but effectively any inference will find the same patterns for the deep relationships in the Fagales.

But there is no need to stop with "asterisk" branches. Networks, even those inferred using tree frameworks (our bootstrap support networks), can illuminate the reasons for ambiguous support. We can put up evolutionary scenarios to explain ambiguous support (not necessarily involving reticulation) or at least we can discuss ambiguous support in an evolutionary context. What are the topological alternatives (here: Myricaceae sister to Juglandaceae or sister to BTC clade)? Which data support which alternative? Are there evolutionary processes such as ancient hybridisation, incomplete lineage sorting, or simply fast radiation, generating such signals? How does this fit with the fossil record (palaeo-distribution in space and time)?

The "asterisk" branches in the angiosperm Tree of Life may be just as relevant for understanding the evolution of a group as the clear ones. Indeed, they may be even more interesting to look at. For sure, they should not be regarded in general as just indecisiveness of available data, i.e. topological uncertainty.