Showing posts with label Admixture. Show all posts

Monday, February 20, 2017

Producing admixture graphs


I have written before about admixture graphs, which are phylogenetic networks that represent reticulations due to introgression:
To date, these graphs have not really been incorporated into the mainstream network literature. Part of the problem has been the rather disparate nature of the admixture literature itself. A paper has recently appeared as a preprint in Bioinformatics that provides a brief introduction to this situation:
  • Kalle Leppälä, Svend Vendelbo Nielsen, Thomas Mailund (2017) admixturegraph: an R package for admixture graph manipulation and fitting. Bioinformatics

There are currently several quite different programs for producing admixture graphs:
  • qpgraph (Castelo and Roberato 2006)
  • TreeMix (Pickrell and Pritchard 2012)
  • AdmixTools (Patterson et al. 2012)
  • MixMapper (Lipson et al. 2013)
  • admixturegraph (see above)
These programs summarize the genetic data in different ways based on genetic drift (eg. the covariance matrix versus so-called f statistics), and construct the graphs in different ways (eg. sequential heuristic building versus a user specified graph). There are also different ways to evaluate the graphs, including fitting the graph parameters using likelihood, and comparing them, including the bootstrap, jackknife, and MCMC.

None of this is ideal. Another problem has been that the graphs are often constructed by hand, and may be needed as input to the programs. However, the biggest limitation is that there are currently no algorithms for inferring the optimal graph topology. This is, of course, the basic problem that needs to be solved for all network construction. To quote the authors with regard to their own R package:
The set of all possible graphs, even when limited to one or two admixture events, grows super-exponentially in the number of leaves, and it is generally not computationally feasible to explore this set exhaustively. Still, we give graph libraries for searching through all possible topologies with not too many leaves and admixture events.
For larger graphs we provide functions for exploring all possible graphs that can be reached from a given graph by adding one extra admixture event or by adding one additional leaf. However, the best fitting admixture graphs are not necessarily extensions of best fitting smaller graphs, so we recommend that users not only expand the best smaller graph but a selected few best of them.
The world of graph-edge rearrangements (NNI, SPR) does not yet seem to have encountered the world of admixture graphs.

Tuesday, October 4, 2016

The practical limits of networks?


Network techniques are becoming more widespread in biology and anthropology. However, the data in both of these disciplines can form very complicated patterns, indeed; and there must be practical limits to what one can do with a network analysis. This post discusses an example that covers both disciplines, and which may well exceed those limits.

The data come from:
Pugach I, Matveev R, Spitsyn V, Makarov S, Novgorodov I, Osakovsky V, Stoneking M, Pakendorf B (2016) The complex admixture history and recent southern origins of Siberian populations. Molecular Biology and Evolution 33: 1777-1795.

The authors note:
Siberia is an extensive geographical region of North Asia stretching from the Ural Mountains in the west to the Pacific Ocean in the east, and from the Arctic Ocean in the north to the Kazakh and Mongolian steppes in the south. This vast territory is inhabited by a relatively small number of indigenous peoples, with most populations numbering only in the hundreds or few thousands. These indigenous peoples speak a variety of languages belonging to the Turkic, Tungusic, Mongolic, Uralic, Yeniseic, Chukotko-Kamchatkan, and Aleut-Yupik-Inuit families, as well as a few isolates. There is also variation in traditional subsistence patterns ... This linguistic and cultural diversity suggests potentially different origins and historical trajectories of the Siberian peoples.
Previous studies of the genetic history of Siberian populations were hampered by the extensive admixture that appears to have taken place among these populations, because commonly used methods assume a tree-like population history and at most single admixture events.
This suggests the use of network techniques, instead of tree-based ones. However, under the circumstances described here it may be unwise to try to produce a phyogenetic network. The situation, as described, does not resemble a "tree with reticulations" but more of an "anastomosing plexus". The latter may be more confusing than helpful, when visualized as a network.

So, the authors do not mention the word "network" nor even "reticulation". Instead:
Here we analyze geogenetic maps and use other approaches to distinguish the effects of shared ancestry from prehistoric migrations and contact, and develop a new method based on the covariance of ancestry components, to investigate the potentially complex admixture history. We furthermore adapt a previously devised method of admixture dating for use with multiple events of gene flow, and apply these methods to whole-genome genotype data [genome-wide SNPs] from over 500 individuals belonging to 20 different Siberian ethnolinguistic groups [plus 9 reference populations].
The results of these analyses indicate that there have been multiple layers of admixture detectable in most of the Siberian populations, with considerable differences in the admixture histories of individual populations.
The admixture (or introgression) patterns among the populations are illustrated using a map. Each bar represents a population, with the colors denoting the different enthnolinguistic groups. Note that every population shows admixture.


The reconstructed migration relationships among the populations are also illustrated using a map. This time, the colors of the arrows represent the different ethnolinguistic groups.


I would not like to have to represent these patterns using a network, and make that network comprehensible. So, this dataset may exceed the practical limits of networks.

Wednesday, August 31, 2016

Network thinking in phylogeography?


This blog has, of course, long championed the importance of network models in phylogenetics. Slowly, very slowly, the rest of the world is catching up.

Apparently, the world of phylogeography has now woken up:
Scott V. Edwards, Sally Potter, C. Jonathan Schmitt, Jason G. Bragg and Craig Moritz (2016) Reticulation, divergence, and the phylogeography–phylogenetics continuum. Proceedings of the National Academy of Sciences of the USA 113: 8025-2032.
Phylogeography was conceived as some sort of connection between population biology and phylogenetics. It has always seemed odd that the tree model has been used in phylogeography at all, because there is no a priori reason to expect within-species phylogenetic patterns to be tree-like. Indeed, inter-breeding seems to suggest quite the opposite. Nevertheless, phylogeographic studies are full of trees.


But apparently no more. To quote the authors:
As phylogeography moves into the era of next-generation sequencing, the specter of reticulation at several levels — within loci and genomes in the form of recombination and across populations and species in the form of introgression — has raised its head with a prominence even greater than glimpsed during the nuclear gene PCR era ... We discuss a variety of forces generating reticulate patterns in phylogeography, including introgression, contact zones, and the potential selection-driven outliers on next-generation molecular markers. We emphasize the continued need for demographic models incorporating reticulation at the level of genomes and populations ...
That phylogeography sits centrally in this process-oriented space emphasizes the importance of understanding interactions between reticulation (gene flow / introgression and recombination), drift, and protracted isolation. This combination of processes sets phylogeography apart from traditional population genetics and phylogenetics.
Scanning entire genomes of closely related organisms has unleashed a level of heterogeneity of signals that was largely of theoretical interest in the PCR era. This genomic heterogeneity is profoundly influencing our basic concepts of phylogeography and phylogenetics, and indeed our views of speciation processes. It is now routine to encounter a diversity of gene trees across the genome that is often as large as the number of loci surveyed.
The new genome-scale analyses are causing evolutionary biologists to reevaluate the very nature of species, which, in some cases, appear to maintain phenotypic distinctiveness despite extensive gene flow across most of the genome, and to recognize introgression as an important source of adaptive traits in a variety of study systems.
The role of horizontal gene flow in speciation and phylogeography, particularly for animal taxa, has long been championed by Michael L. Arnold (see the references). However, the authors ignore this literature, and claim that this is a recent insight, instead. They also mention only in passing the extensive genomics literature on human introgression, where it is called "admixture". Indeed, they mention only a data-analysis technique, rather than the biological insights that have arisen. It is still disappointing just how little information-connection there is between different fields of biology.

Finally, the authors manage to mention the work "network" only three times in the whole paper. Their key word is "reticulation", instead, in the sense that a phylogeny is a tree with reticulation, rather than any other form of network. So, they are still only one step away from tree-thinking, and at least one step from true network-thinking.

In the context of trees versus networks, the authors mention so-called "species tree" methods based on the multispecies coalescent, which try to account for incomplete lineage sorting in genome studies (see also Edwards et al. 2016). Unfortunately, these have recently been shown to be inconsistent in the presence of gene flow (Solís-Lemus et al. 2016), thus emphasizing the need for proper network methods.

References

Arnold ML (1997) Natural Hybridization and Evolution. Oxford University Press.

Arnold ML (2006) Evolution Through Genetic Exchange. Oxford University Press.

Arnold ML (2009) Reticulate Evolution and Humans – Origins and Ecology. Oxford University Press.

Arnold ML (2016) Divergence With Genetic Exchange. Oxford University Press.

Edwards SV, Xi Z, Janke A, Faircloth BC, McCormack JE, Glenn TC, Zhong B, Wu S, Lemmon EM, Lemmon AR, Leaché AD, Liu L, Davis CC (2016) Implementing and testing the multispecies coalescent model: a valuable paradigm for phylogenomics. Molecular Phylogenetics & Evolution 94: 447-462.

Solís-Lemus C, Yang M, Ané C (2016) Inconsistency of species tree methods under gene flow. Systematic Biology 65: 843–851.

Wednesday, September 30, 2015

Are networks actually used to explore reticulate histories?


A look at the modern literature clearly shows that many, if not most, researchers do not use network methods when exploring reticulate evolutionary histories. As examples of the range of possible approaches, I will briefly discuss two papers from a recent journal issue.

Archaic introgression
Pengfei Qin and Mark Stoneking (2015) Denisovan ancestry in East Eurasian and Native American populations. Molecular Biology and Evolution 32: 2665-2674.
The data used for this study of archaic introgression in hominids were genome-wide SNPs from 2,493 modern humans, plus a chimpanzee and two fossils, one from the only known Denisovan individual and one from a Neandertal. The data were reduced to f4 summary statistics, which assess the correlation between the allele frequency differences of two pairs of populations. (If populations A and B are consistent with forming a clade with respect to populations C and D, then the f4 statistic is expected to be 0.) The proportions of introgressions between populations were then calculated as the ratios between selected f4 statistics. Finally, the results of the series of calculations were presented as an admixture (or introgression) network.


There are design problems with this experiment, but at least the authors do use an explicit method to produce the introgression pattern for their phylogenetic network. They do, however, draw the network manually.

The obvious experimental problem is lack of replication, which is a basic requirement of traditional science. In this case, the work is ostensibly about archaic introgression, but there is no replication of the Denisovan, Neandertal or chimpanzee samples, which are the key ones for quantifying archaic patterns. Mind you, there are only a couple of bones of the Denisovan, so the lack of replication is hardly surprising, however regrettable it may be.

There are also technical problems, such as the artifactual arch pattern in the PCA plot (see Distortions and artifacts in Principal Components Analysis analysis of genome data).

Finally, note that the "introgression" arrows in the network do not point from the ostensible source but always from a sister taxon of that source. This is basically the argument that we cannot know ancestors, and so we must represent them as sister taxa to their putative descendants in an evolutionary diagram.

Yeast recombination
Baojun Wu, Adnan Buljic and Weilong Hao (2015) Extensive horizontal transfer and homologous recombination generate highly chimeric mitochondrial genomes in yeast. Molecular Biology and Evolution 32: 2559-2570.
The authors studied aligned sequences of 40 mitochondrial genomes from yeasts, and report "extensive, homologous-recombination-mediated, mitochondrial-to-mitochondrial HGT, leading to genomes that are highly chimeric." Recombination was evaluated using various methods from the RDP4 program. Horizontal gene transfer (HGT) was evaluated by comparing different mitochondrial genome regions (introns as well as exons). No phylogenetic network was presented to summarize the phylogenetic relationships, just a long series of incongruent gene (or locus) trees.

The lack of a network summary of HGT studies is quite common. This is in spite of programs available to evaluate HGT and display the results. The focus in such studies seems to be on mechanisms, instead, rather than on the phylogenetic history.

The general experimental issue with the study of HGT is that evidence for it is solely inference from incongruence: (i) incongruent gene trees must be the result of either incomplete lineage sorting (ILS), gene duplication-loss (DL) or gene flow, and (ii) if it is the latter and the taxa are not closely related, then it is called HGT. This is not particularly evidence, especially when ILS and DL are not explicitly evaluated. These days, there are several methods available for doing this.

Wednesday, July 1, 2015

Networks of admixture or introgression

There are several processes that create reticulate phylogenetic topologies, including hybridization, introgression (or admixture) and horizontal gene transfer (HGT). Biologically, introgression operates via the same mechanism as does hybridization (ie. during sexual reproduction), but it results in only a small amount of genetic material entering the recipient genome, making an admixed genome that is similar to the end result of HGT.

Constructing phylogenetic networks in situations where introgression or HGT have occurred has been somewhat different in practice to that used for hybridization. Hybridization has usually been tackled by merging incongruent tree topologies, based on the idea that the different topologies represent the phylogenetic history of the different genomes of the hybrid taxon. Introgression and HGT have usually been tackled by adding reticulation edges to a phylogenetic tree, on the basis that the tree represents the phylogenetic history of the main part of the genome.

So, the study of introgression (and HGT) involves (a) constructing a phylogenetic tree from some genomic sample, and (b) detecting the introgressed (or HGT) parts of the genome. This is potentially a problematic procedure, because how do we construct a phylogenetic tree from data that already contain non-tree components? Apparently, the expectation is that a single tree will be supported by the majority of the data, and the remainder will represent the introgressed (or HGT) pathways(s), plus whatever other components have created the observed genomic variability (such as incomplete lineage sorting, gene duplication-loss, and stochastic mutations).

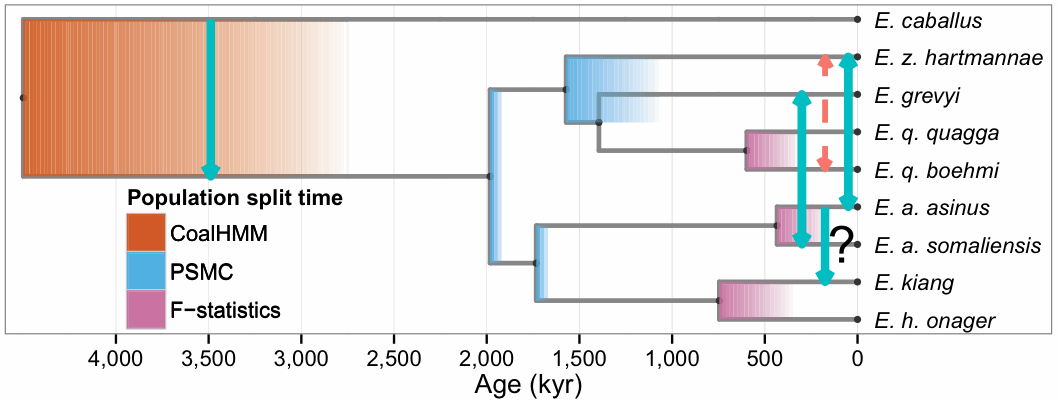
Recently, there have been quite a few studies published that have adopted a specific protocol for this procedure, usually under the rubric of admixture. Most of these have involved the study of ancient human DNA, but there have also been studies of contemporary humans, as well as ancient non-humans, An example of the latter is shown in the next two figures, which represent parts (a) and (b), respectively. They are taken from this study of the relatives of horses: Hákon Jónsson, et alia (2014) Speciation with gene flow in equids despite extensive chromosomal plasticity. Proceedings of the National Academy of Sciences of the USA 111: 18655-18660.


The phylogenetic tree (step a) was constructed using "maximum likelihood inference and 20,374 protein-coding genes ... based on a relaxed molecular clock." So, only stochastic mutations were accounted for when constructing the tree, and not incomplete lineage sorting or gene duplication-loss.

The detection of introgression (step b) used "the D statistics approach, which tests for an excess of shared polymorphisms between one of two closely related lineages (E1 or E2) and a third lineage (E3)". The reticulations representing the detected gene flow were then added to the tree manually.

The D-statistic is also known as the ABBA-BABA test (see: Patterson NJ et alia. 2012. Ancient admixture in human history. Genetics 192: 1065-1093). It operates as follows for sets of four taxa, applied to character data.

Let the species tree be this, where E1–E3 are the three taxa being compared, and O is the outgroup:


There are three possible allele trees for each binary character (ie. single nucleotide polymorphism) in which states are shared pairwise:


In the first tree, E3 shares the ancestral character state with the outgroup, which is expected to be the most common pattern in the absence of gene flow. E1 and E2 share the ancestral state with the outgroup in the second and third trees, respectively.

The admixture test compares the ABBA tree to the BABA tree. The expectation is that if there has been no introgression then the data support for these two trees should be equal. That is, under the null hypothesis that there is no gene flow between the species (and the underlying species tree is correct), the difference in the expected number of occurrences of the ABBA and BABA patterns should be zero. Deviation from this expectation is statistically evaluated using a jackknife procedure.

When there are more than three ingroup taxa, they are tested in groups of three (plus the outgroup). No correction for multiple hypothesis testing seems ever to be applied. Recently, the test has been extended to five taxa (Pease JB, Hahn MW. 2015. Detection and polarization of introgression in a five-taxon phylogeny. Systematic Biology 64: 651-662).

Note that this test assumes that:
  • the "excess of shared polymorphisms" arises solely from gene flow, with or without incomplete lineage sorting, rather than from any other tree-like processes such as gene duplication-loss or ancestral population structure
  • there are no other sources of co-ordinated polymorphisms, such as character-state reversals due to adaptation / selection
  • any gene flow that does exist is due to introgression, rather than to hybridization or HGT.
How realistic these assumptions are is not immediately obvious.

Wednesday, February 18, 2015

Representing macro- and micro-evolution in a network


In biology we often distinguish microevolutionary events, which occur at the population level, from macroevolutionary events, which involve species. We have traditionally treated phylogenetics as a study of macroevolution. However, more recently there has been a trend to include population-level events, such as incomplete lineage sorting and introgression.


This is of particular importance for the resulting display diagrams. A phylogenetic tree was originally conceived to represent macroevolution. For example, speciation and extinction occur as single events at particular times, and these events apply to discrete groups of organisms. The taxa can be represented as distinct lineages in a tree graph, and the events by having these lineages stop or branch in the graph.

This idea is easily extended to phylogenetic networks, where the gene-flow events are also treated as singular, so that hybridization or horizontal gene transfer can be represented as single reticulations among the lineages.

These are sometimes called "pulse" events. However, there are also "press" events that are ongoing. That is, a lot of genetic variation is generated where populations repeatedly mix, so that every gene-flow instance is part of a continuous process of mixing. This often occurs, for example, in the context of isolation by distance, such as ring species or clinal variation. Under these circumstances, processes like introgression and HGT can involve ongoing events.

For instance, in an earlier life I once studied three species of plant in the Sydney region (Morrison DA, McDonald M, Bankoff P, Quirico P, Mackay D. 1994. Reproductive isolation mechanisms among four closely-related species of Conospermum (Proteaceae). Botanical Journal of the Linnean Society 116: 13-31). One of the species was ecologically isolated from the other two (it occurred in dry rather than damp habitats), and the other two were geographically isolated from each other (they occurred on separate sandstone uplands with a large valley in between). These species look very different from each other, as shown in the picture above, but looks are deceiving. Where the ecological isolation was incomplete, introgression occurred and admixed populations could be found.

These dynamics are more difficult to represent in a phylogenetic tree or network. We do not have discrete groups that can be represented by lines on a graph, but instead have fuzzy groups with indistinct boundaries. Furthermore, we do not have discrete events, but instead have ongoing (repeated) processes.

Nevertheless, it seems clear that there is a desire in modern biology to integrate macroevolutionary and microevolutionary dynamics in a single network diagram. That is, some parts of the diagram will represent pulse events involving discrete groups and other parts will represent press events among fuzzy groups. This situation seems to be currently addressed by practitioners by first creating a tree to represent the pulse events (and possibly their times), and then adding imprecisely located dashed lines as a representation of ongoing gene flow — see the example in Producing trees from datasets with gene flow. This particular mixture of precision and imprecision seems rather unsatisfactory.

Perhaps someone might like to have a think about this aspect of phylogenetic networks, to see if there is some way we can do better.

Wednesday, February 11, 2015

Producing trees from datasets with gene flow


Recently, a number of computer programs have been released that are intended to produce phylogenetic networks representing introgression (or admixture) (see Admixture graphs – evolutionary networks for population biology).

A recent example of the use of these programs is presented by:
Jónsson H, Schubert M, Seguin-Orlando A, Ginolhac A, Petersen L, Fumagalli M, Albrechtsen A, Petersen B, Korneliussen TS, Vilstrup JT, Lear T, Myka JL, Lundquist J, Miller DC, Alfarhan AH, Alquraishi SA, Al-Rasheid KA, Stagegaard J, Strauss G, Bertelsen MF, Sicheritz-Ponten T, Antczak DF, Bailey E, Nielsen R, Willerslev E, Orlando L (2014) Speciation with gene flow in equids despite extensive chromosomal plasticity. Proceedings of the National Academy of Sciences of the USA 111: 18655-18660.
This study presents a phylogenetic analysis of the extant genomes of the genus Equus, the horses, asses and zebras. This analysis leads the authors to the conclusion that there is "evidence for gene flow involving three contemporary equine species despite chromosomal numbers varying from 16 pairs to 31 pairs." The gene flow is indicated by the light-blue reticulations in the first diagram.


One important issue with these types of analyses is the logic on which the procedure is based. Programs like TreeMIx (used in this analysis) were developed to allow modelling of gene flow across the branches of trees at a microevolutionary (population) scale. Specifically, the graph generated by TreeMix models singular (pulse) introgression events in phylogenetic history.

The issue is that a tree is produced first, and then reticulations are added to it. The tree represents descent and the reticulations represent gene flow. But how do we produce a tree from a dataset that contains evidence of both descent and gene flow? The authors' initial tree is shown below.


The procedural logic works as follows:
(i) we assume that the traditionally recognized species exist
(ii) we assume that we have a representative sample of them, with one genome each
(iii) we construct a tree based on the assumption that there is no gene flow among the species
(iv) we then assess the species for gene flow, and discover it.

Isn't this rather circular? Surely (iv) invalidates the assumptions inherent in (i)-(iii)? How can we then assess the reliability of the sampling in (ii) and the analyses in (iii)? Why have we made assumption (i)? At best the species are fuzzy groups to one extent or another, and we do not know where we have sampled within the probabilistic space assigned to the groups.

This seems like a very poor way to go about studying the interaction between descent and gene flow. First we assume descent only, and then we assess gene flow. When we find gene flow we continue to accept the results of the initial analyses based on descent alone.

I would hate to have to justify this philosophy to someone outside phylogenetics, because I have a horrible feeling that they would either smile tolerantly or laugh outright.

This between-species situation is even more extreme for those within-species patterns where groups are recognized. Human races and domesticated breeds are two concepts that have received constant criticism. Neither races nor breeds form clear-cut groups, as there are no sharp boundaries between them, due to gene flow. Their "central locations" in genotype space are usually very different, however. Therefore it is quite possible to perform a tree-based analysis of samples from the central locations, and this would tell us a lot about descent. But it would tell us almost nothing about gene flow; and we would have a very distorted view of the phylogenetic history.

Thursday, October 4, 2012

Open questions about evolutionary networks, part 1


There are a number of issues that have been of interest to the phylogenetics community with regard to the construction of evolutionary trees that have not yet been addressed for evolutionary networks. These can be considered to be "open questions" — ones that need widespread discussion at some stage, either by biologists or by computational scientists (or both). In this blog post I list some of these, and provide a brief introduction to them. I will continue the list in future blog posts (Part 2 and Part 3).

Optimization criteria

Phylogenetic analysis has been treated mainly as a mathematical optimization problem. There seem to be two types of data that can be optimized:

  • (i) character-state changes (eg. nucleotide substitution, nucleotide insertion / deletion, or their amino acid equivalents), and
  • (ii) character-block events (eg. inversion, duplication / loss, transposition, recombination, hybridization, horizontal gene transfer).

To date, phylogenetic tree-building has concentrated on (i), and methods have been developed using optimization criteria such as minimum distance, maximum parsimony, maximum likelihood, and bayesian analysis (which, strictly speaking, does not involve an optimization criterion).

Most of the data-display network methods have also been based on optimizing data-type (i), notably the splits-graph methods (see this primer), which conceptually can be seen as based on either maximum parsimony or minimum distance. Moreover, it is possible to optimize the character data directly onto a network by maximizing either the parsimony scores (eg. Hein 1990, 1993; Dickerman 1998; Nakhleh et al. 2005; Jin et al. 2006a, 2007a, 2007b) or the likelihood scores (eg. von Haeseler and Churchill 1993; Strimmer and Moulton 2000; Strimmer et al. 2001; Jin et al. 2006b; Snir and Tuller 2009). The likelihood scores can also be evaluated in a bayesian context (Radice 2011).

However, evolutionary networks can differ from evolutionary trees by explicitly taking into account data-type (ii), either instead of or in addition to (i). So far, maximum parsimony has been the criterion of choice for doing this, in the sense that the available methods minimize the count of the number of events. For example, a large amount of work has been done to minimize the number of reticulation nodes when reconciling a set of incompatible phylogenetic trees, or alternatively minimizing the level (see this blog post).

However, this means that there are currently few available likelihood-based methods that will allow us to build networks directly from quantitative evolutionary models of how non-tree events occur. The most obvious exception here is the recent development of Admixture graphs (see this blog post), some at least of which are based on an approximate maximum-likelihood model (Pickrell and Pritchard 2012).

This seems to be a serious omission, given that model-based methods are among the most widely used of those available for phylogenetic trees, at least among those users who want a robust analysis (Kelchner and Thomas 2006). Likelihood has effectively replaced maximum parsimony as an optimization criterion for tree building. (The quick-and-dirty distance-based methods will probably always out-rank the other methods, because they can be useful as a "first approximation".)

It may not be easy to create likelihood models for non-tree events, perhaps even more so given the number of different types of events that need to be modelled. Nevertheless, the lack of such models seems to be a handicap for the widespread acceptance of network-based methods.

Partitioned models for likelihood analyses 

This topic is a direct extension of the previous one. Current likelihood models for tree-building analyses can be applied independently to different partitions of the type-(i) character data, and this partitioning is considered to be a valuable part of any likelihood analysis (eg. Blair and Murphy 2011). Indeed, it is the desirability of model partitioning that seems to be a major component of the increasing move from maximum likelihood to bayesian analysis, as well as the ease of implementing models that deal with heterogeneity among and within lineages (especially relaxed molecular clocks).

Partitioned models allow us to add complexity that can deal with heterogeneity within a dataset (Endicott et al. 2009), by a priori or a posteriori choice of partitions with greater inter- than intra-partition variability in substitution rates. For example, there is substitution-rate heterogeneity within genes (eg. different codon positions in protein-coding genes, paired versus unpaired positions in RNA-coding genes), as well as between genes (e.g. house-keeping genes versus rRNA-coding genes), between coding and non-coding regions (e.g. introns versus exons, as well as transcribed spacers and the mitochondrial control region), and between genomes (e.g. nuclear versus mitochondrial). Failure to correctly account for this heterogeneity can seriously mislead phylogenetic analyses; and automated procedures for devising partition schemes have now been developed (eg. Lanfear et al. 2012).

Partitioning is not a panacea for heterogeneity, of course, and there are potential problems that need to be addressed concerning partition choice and its consequences (see Brown et al. 2010; Marshall 2010; Fan et al. 2011). None of these issues have yet been addressed in the context of evolutionary networks, although there seems to be no barrier to the use of partitioning for network likelihood models. On the other hand, dealing with evolutionary heterogeneity among and within lineages may actually be a bigger problem, given the increased complexity of the lineages in a network.

Mixture models for likelihood analyses

An alternative approach to dealing with heterogeneity is through the use of mixture models. Here, the likelihood of each character is calculated under more than one model, and these likelihoods are then combined. For example, the parameters of several substitution models, as well as the probability with which each model applies to each alignment position, can be determined directly from the data. Such models have been developed for nucleotide (Pagel and Meade 2004) and amino-acid (Le et al. 2008) sequences, but this is otherwise a very under-explored part of phylogenetic analysis. Nevertheless, computer programs are becoming more readily available (eg. Stamatakis 2006).

It would presumably be possible to combine data types (i) and (ii) using this approach. Indeed, this has obvious theoretical advantages for networks, although the resulting models may be overly complex. It seems likely that the ability to model, say, hybridization versus recombination, as alternative causes of reticulations in a phylogeny will be a part of any successful attempt to produce a widely used method of phylogenetic analysis.

References

Blair C., Murphy R.W. (2011) Recent trends in molecular phylogenetic analysis: where to next? Journal of Heredity 102: 130-138.

Brown J.M., Hedtke S.M., Lemmon A.R., Moriarty Lemmon E. (2010) When trees grow too long: investigating the causes of highly inaccurate bayesian branch-length estimates. Systematic Biology 59: 145-161.

Dickerman A.W. (1998) Generalizing phylogenetic parsimony from the tree to the forest. Systematic Biology 47: 414-426.

Endicott P., Ho S.Y.W., Metspalu M., Stringer C. (2009) Evaluating the mitochondrial timescale of human evolution. Trends in Ecology and Evolution 24: 515-521.

Fan Y., Wu R., Chen M.-H., Kuo L., Lewis P.O. (2011) Choosing among partition models in bayesian phylogenetics. Molecular Biology and Evolution 28: 523-532.

Hein J. (1990) Reconstructing evolution of sequences subject to recombination using parsimony. Mathematical Biosciences 98: 185-200.

Hein J. (1993) A heuristic method to reconstruct the history of sequences subject to recombination. Journal of Molecular Evolution 36: 396-405.

Jin G., Nakhleh L., Snir S., Tuller T. (2006a) Efficient parsimony-based methods for phylogenetic network reconstruction. Bioinformatics 23: e123-e128.

Jin G., Nakhleh L., Snir S., Tuller T. (2006b) Maximum likelihood of phylogenetic networks. Bioinformatics 22: 2604-2611.

Jin G., Nakhleh L., Snir S., Tuller T. (2007a) Inferring phylogenetic networks by the maximum parsimony criterion: a case study. Molecular Biology and Evolution 24: 324-337.

Jin G., Nakhleh L., Snir S., Tuller T. (2007b) A new linear-time heuristic algorithm for computing the parsimony score of phylogenetic networks: theoretical bounds and empirical performance. Lecture Notes in Bioinformatics 4463: 61-72.

Kelchner S.A., Thomas M.A. (2006) Model use in phylogenetics: nine key questions. Trends in Ecology and Evolution 22: 87-94.

Lanfear R., Calcott B., Ho S.Y.W., Guindon S. (2012) PartitionFinder: combined selection of partitioning schemes and substitution models for phylogenetic analyses. Molecular Biology and Evolution 29: 1695-1701.

Le S.Q., Lartillot N., Gascuel O. (2008) Phylogenetic mixture models for proteins. Philosophical Transactions of the Royal Society of London, B: Biological Sciences 363: 3965-3976.

Marshall D.C. (2010) Cryptic failure of partitioned bayesian phylogenetic analyses: lost in the land of long trees. Systematic Biology 59: 108-117.

Nakhleh L., Jin G., Zhao F., Mellor-Crummey J. (2005) Reconstructing phylogenetic networks using maximum parsimony. In: Proceedings of the 2005 IEEE Computational Systems Bioinformatics Conference, pp. 93-102. IEEE Computer Society, Washington DC.

Pagel M., Meade A. (2004) A phylogenetic mixture model for detecting pattern-heterogeneity in gene sequence or character-state data. Systematic Biology 53: 571-581.

Pickrell J.K., Pritchard J.K. (2012) Inference of population splits and mixtures from genome-wide allele frequency data. Unpublished ms (http://arxiv.org/abs/1206.2332).

Radice R. (2011) A Bayesian Approach to Phylogenetic Networks. PhD thesis, University of Bath, UK.

Snir S., Tuller T. (2009) The NET-HMM approach: phylogenetic network inference by combining maximum likelihood and hidden markov models. Journal of Bioinformatics and Computational Biology 7: 625-644.

Stamatakis A. (2006) RAxML-VI-HPC: maximum likelihood-based phylogenetic analyses with thousands of taxa and mixed models. Bioinformatics 22: 2688-2690.

Strimmer K., Moulton V. (2000) Likelihood analysis of phylogenetic networks using directed graphical methods. Molecular Biology and Evolution 17: 875-881.

Strimmer K., Wiuf C., Moulton V. (2001) Recombination analysis using directed graphical models. Molecular Biology and Evolution 18: 97-99.

von Haeseler A., Churchill G.A. (1993) Network models for sequence evolution. Journal of Molecular Evolution 37: 77-85.

Wednesday, September 12, 2012

Admixture graphs – evolutionary networks for population biology


Current methods for evolutionary networks include: (i) combining trees, clusters or triplets into what is usually called a hybridization network (but could also be a horizontal gene transfer network, HGT), and (ii) decomposing ordered character data into what is called a recombination network (or ancestral recombination graph). Much work on these two approaches has been carried out recently within the bioinformatics community, and this is continuing.

However, the biology community has sometimes taken a different approach. Notably, work has concentrated on constructing models for detecting reticulation events in various types of molecular data, such as comparative genome analysis for HGT, or quantifying inter-population gene flow (eg. due to migration). A network is then manually constructed by adding reticulation branches to a phylogenetic tree of the organisms concerned. Indeed, in many cases the network diagram is not presented explicitly in the publications, but is merely implied from a list of the sources and sinks of the gene flows detected.

The network model for this latter type is thus essentially "a tree obscured by vines", although the network can actually become rather complicated. The basic idea has a long history (Lathrop 1982), although it has only recently become popular. In this blog post I highlight one line of recent work that takes this approach, which involves admixture graphs in population genetics.

Introduction

Historically, population genetics has concentrated on estimating various population parameters from quantitative models of gene history, notably rates of population expansion/contraction, rates of migration, timing of divergence, and presence/absence of bottlenecks. This is rarely done in any graphical way, relying instead on summary statistics. Alternatively, graphical methods such as principal components analysis and agglomerative clustering have been used to summarize the genetic data, and from this summary various scenarios can be deduced post hoc about possible population history (e.g. Skoglund and Jakobsson 2011; Hodoglugil and Mahley 2012).

However, more recently, explicit models of historical gene flow between populations have been developed, usually within the context of generalizing a phylogenetic tree. A tree can be used to represent historical relationships in the absence of significant amounts of gene flow, but not otherwise. So, the general approach has been to use a tree as the null model (representing absence of gene flow), and then testing how many reticulation events are needed to significantly improve the fit of the data to an increasingly complex network. The resulting diagram is called an admixture graph, which thus models both population divergence and gene flow. The reticulations represent the different proportions of genetic mixing between pairs of populations.

A model of population separation and admixture, from Reich et al. (2011) p. 522.

Methods

There are several computer programs that quantify population structure in the presence of admixture between populations, such as the models used in the older programs Structure, BAP5 and TESS (see François and Durand 2010), as well as in more recent programs like Admixture (Alexander et al. 2009). However, the most recent programs have been developed specifically to deal with network analysis of genome-wide single nucleotide polymorphism (SNP) data. The populations studied will usually be within a single species, but this need not be so.

The TreeMix program (Pickrell and Pritchard 2012) is described by the authors as follows: "Our goal is to provide a statistical framework for inferring population networks that is motivated by an explicit population genetic model, but sufficiently abstract to be computationally feasible for genome-wide data from many populations (say, 10-100) ... Our approach to this problem is to first build a maximum likelihood tree of populations. We then identify populations that are poor fits to the tree model, and model migration events involving these populations." This process proceeds as for the standard tree-based approach except that the likelihood model also includes migration weights: "Estimation involves two major steps. First, for a given graph topology, we need to find the maximum likelihood branch lengths and migration weights. Second, we need to search the space of possible graphs. [For] a given graph topology, we iterate between optimizing the branch lengths and weights ... [Then,] to search the space of possible graphs, we take a hill-climbing approach."

This method has been used by, for example, Pickrell et al. (2012).
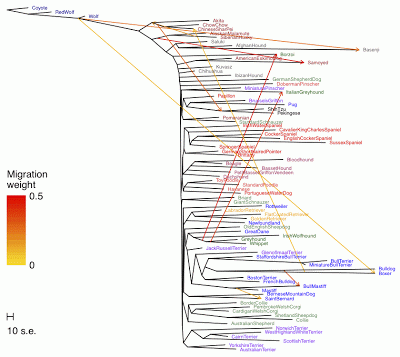
Inferred dog breed admixture graph, from Pickrell and Pritchard (2012).

The AdmixTools program (Patterson et al. 2012), as claimed by the authors, "has some similarities to the TreeMix method but differs in that TreeMix allows users to automatically explore the space of possible models and find the one that best fits the data (while our method does not), while our method provides a rigorous test for whether a proposed model fits the data (while TreeMix does not)." The explicit testing of the fit of data and model is "based on studying patterns of allele frequency correlations across populations. The 3-population test is a formal test of admixture and can provide clear evidence of admixture, even if the gene flow events occurred hundreds of generations ago. The 4-population test ... is also a formal test for admixture, which can not only provide evidence for admixture but also provide some information about the directionality of the gene flow. The F4 ratio estimation allows inference of the mixing proportions of an admixture event".

This approach has been used by Reich et al. (2009, 2011, 2012).

Distinct streams of gene flow from Asia into America, from Reich et al. (2012) p. 372.

These methods have not yet been subjected to any critical evaluation independently of their developers, although various blog authors have been actively investigating them (e.g. these posts by Dienekes Pontikos: 1, 2, 3). The general approach, of adding reticulations to an initial tree, is reminiscent of that taken by the T-Rex program to produce reticulograms, which has been subject to criticisms (Gauthier and Lapointe 2002, 2007; Huson et al. 2011), some of which may apply to the admixture methods as well.

References

Alexander D.H., Novembre J., Lange K. (2009) Fast model-based estimation of ancestry in unrelated individuals. Genome Research 19: 1655-1664.

François O., Durand E. (2010) Spatially explicit Bayesian clustering models in population genetics. Molecular Ecology Resources 10: 773-784.

Gauthier O., Lapointe F.-J. (2002) A comparison of alternative methods for detecting reticulation
events in phylogenetic analysis. In: Jajuga K., Sokolowski A., Bock H.-H. (eds) Classification, Clustering, and Data Analysis: Recent Advances and Applications, pp. 341-347. Springer, Berlin.

Gauthier O., Lapointe F.-J. (2007) Hybrids and phylogenetics revisited: a statistical test of hybridization using quartets. Systematic Botany 32: 8-15.

Hodoglugil U., Mahley R.W. (2012) Turkish population structure and genetic ancestry reveal relatedness among Eurasian populations. Annals of Human Genetics 76: 128-141.

Huson D.H., Rupp R., Scornavacca C. (2011) Phylogenetic Networks: Concepts, Algorithms and Applications. Cambridge University Press, Cambridge.

Lathrop G.M. (1982) Evolutionary trees and admixture: phylogenetic inference when some populations are hybridized. Annals of Human Genetics 46: 245-55.

Patterson N.J., Moorjani P., Luo Y., Mallick S., Rohland N., Zhan Y., Genschoreck T., Webster T., Reich D. (2012) Ancient admixture in human history. Genetics (in press).

Pickrell J.K., Patterson N., Barbieri C., Berthold F., Gerlach L., Lipson M., Loh P.-R., Güldemann T., Kure B., Mpoloka S.W., Nakagawa H., Naumann C., Mountain J.L., Bustamante C.D., Berger B., Henn B.M., Stoneking M., Reich D., Pakendorf B. (2012) The genetic prehistory of southern Africa. Unpublished ms.

Pickrell J.K., Pritchard J.K. (2012) Inference of population splits and mixtures from genome-wide allele frequency data. Unpublished ms.

Reich D., Patterson N., Campbell D., Tandon A., Mazieres S., Ray N., Parra M.V., Rojas W., Duque C., Mesa N., García L.F., Triana O., Blair S., Maestre A., Dib J.C., Bravi C.M., Bailliet G., Corach D., Hünemeier T., Bortolini M.C., Salzano F.M., Petzl-Erler M.L., Acuña-Alonzo V., Aguilar-Salinas C., Canizales-Quinteros S., Tusié-Luna T., Riba L., Rodríguez-Cruz M., Lopez-Alarcón M., Coral-Vazquez R., Canto-Cetina T., Silva-Zolezzi I., Fernandez-Lopez J.C., Contreras A.V., Jimenez-Sanchez G., Gómez-Vázquez M.J., Molina J., Carracedo A., Salas A., Gallo C., Poletti G., Witonsky D.B., Alkorta-Aranburu G., Sukernik R.I., Osipova L., Fedorova S.A., Vasquez R., Villena M., Moreau C., Barrantes R., Pauls D., Excoffier L., Bedoya G., Rothhammer F., Dugoujon J.M., Larrouy G., Klitz W., Labuda D., Kidd J., Kidd K., Di Rienzo A., Freimer N.B., Price A.L., Ruiz-Linares A. (2012) Reconstructing Native American population history. Nature 488: 370-374.

Reich D., Patterson N., Kircher M., Delfin F., Nandineni M.R., Pugach I., Ko A.M., Ko Y.-C., Jinam T.A., Phipps M.E., Saitou N., Wollstein A., Kayser M., Pääbo S., Stoneking M. (2011) Denisova admixture and the first modern human dispersals into Southeast Asia and Oceania. American Journal of Human Genetics 89: 516-528.

Reich D., Thangaraj K., Patterson N., Price A.L., Singh L. (2009) Reconstructing Indian population history. Nature 461: 489-494.

Skoglund P., Jakobsson M. (2011) Archaic human ancestry in East Asia. Proceedings of the National Academy of Sciences of the USA 108: 18301-18306.