Following on from my previous posts about the SARS-CoV-2 virus, and Covid-19, the human disease that it causes, there are a number of miscellaneous topics that could also be discussed. So, here are a few topics about the spread of the pandemic, which may be of interest.
Networks of cases
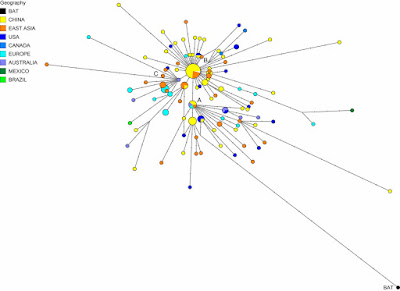
I have so far not presented a phylogenetic network related to the current pandemic. I may one day do so, although collating the data I would like to use will not be easy. In the meantime, the folks over at Fluxus Engineering did publish a network of genomes back in April: Phylogenetic network analysis of SARS-CoV-2 genomes.
The authors identified:
... three central variants distinguished by amino acid changes, which we have named A, B, and C, with A being the ancestral type according to the bat outgroup coronavirus. The A and C types are found in significant proportions outside East Asia, that is, in Europeans and Americans. In contrast, the B type is the most common type in East Asia, and its ancestral genome appears not to have spread outside East Asia without first mutating into derived B types, pointing to founder effects or immunological or environmental resistance against this type outside Asia.Needless to say, their paper generated some controversy, with three published responses criticizing the methodology (these are shown at the link above). However, the Global Initiative on Sharing All Influenza Data (GISAID) uses an expanded version of their cladistic classification.
Networks can also be used much more locally, to illustrate spread, although in an epidemic this will almost always be tree-like rather than reticulating. Here is a recent example from China: Large SARS-CoV-2 outbreak caused by asymptomatic traveler. The authors comment about the wide spread from a one individual:
An asymptomatic person infected with severe acute respiratory syndrome coronavirus 2 returned to Heilongjiang Province, China, after international travel. The traveler’s neighbor became infected and generated a cluster of >71 cases, including cases in 2 hospitals. Genome sequences of the virus were distinct from viral genomes previously circulating in China.

Different patterns of infection among communities
Pandemics are actually a series of local epidemics, and are therefore rarely simple things, in terms of when people become infected. For example, there are often a series of alternating "waves" of new cases, in response to the behavior of either the pathogen or the people themselves.
In the case of the Covid-19 disease, the virus has so far apparently produced a series of at least seven variant strains (Geographic and genomic distribution of SARS-CoV-2 mutations), but the waves are mainly the result of people's implementation of infection control measures. Depending on the pathogen, these measures can include: social distancing, fewer / smaller crowds (especially indoors), working from home, closing social venues such as restaurants and bars, as well as mass testing and infection tracking. Reducing the spread of breath aerosols also works well for SARS-CoV-2, including careful cleaning of surfaces, and wearing gloves and masks or visors.
So, early on in most epidemics, people get infected because they are not ready to deal with things; and the number of cases increases, as shown in the above graph of Covid-19 cases in the USA this year — this is the First Wave. The number of cases then usually decreases for a while, in response to the effectiveness of the control measures. However, if the measures do not remain effective, or the people get sick of implementing them, then the number of cases increases again, creating the Second Wave. The graph above makes it clear that for the USA the Second Wave has been much more serious than the First, in terms of the number of cases.
However, this picture is often much too simple, because the USA is a pretty big place. In this example, there are 50 main jurisdictions in the country, and there is no reason to expect any epidemic to proceed in the same way in every state and territory. Here are equivalent graphs for four different US states, each showing a different pattern of waves.
So, New York (and several other north-eastern states) got the SARS-CoV-2 virus early on, and most of the at-risk people got infected at that time, so that there has not yet been a Second Wave. Rhode Island, on the other hand, has actually had a small Second Wave. From here on in the north-east, infections are likely to be mostly local outbreaks (eg. New York city mayor says rise in Covid-19 cases in Brooklyn not a cluster), such as is now also being observed in Europe.
By contrast, Louisiana, the state with the highest percent of cases (per population) so far, had a relatively small First Wave, and it is the Second Wave that has been much more problematic for epidemic control. Even more extreme, Florida (and other states like California) had the virus spread much later, so that there was not really a First Wave at the same time as the other states, and it is the Second Wave that is producing the high percentage of infected people.
So, the country's pattern of pandemic spread is made up of a series of different sub-patterns of epidemics, with different jurisdictions having very different degrees of success in controlling virus spread. This matters very much for any national response to the pandemic, because it is not the same epidemic everywhere.
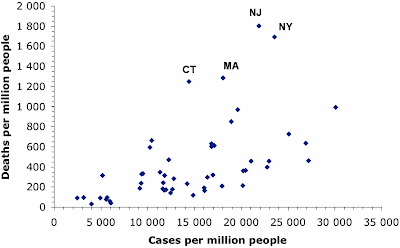
In a similar manner, deaths have been concentrated in those places that got the SARS-CoV-2 virus early on. We expect for most pandemics that the number of deaths will rise as the number of infection cases rises. This next graph shows the case rates (proportion of people infected) and death rates (proportion of people who have died) in each US state (each point represents one state, plus DC).
The proportion of cases varies from a low in Vermont to a high in Louisiana, and the proportion of deaths rises along with this — 44% of the variation in deaths between states is correlated with the difference in case rate. However, there are four states in the north-east of the country (as labeled on the graph) where the death rate has been much higher than expected (about double). These states all got their virus infections early in the pandemic, so that one or more of these has been happening:
- the deaths predominantly occurred before effective treatment strategies were developed;
- the at-risk groups are now being protected more effectively; or
- the currently predominant strains of the virus are less deadly than those circulating originally.
Comparing lock-downs to voluntary isolation
Many governments have responded to the spread of SARS-CoV-2 by instituting economic lock-downs as a form of quarantine, to keep their populace apart from each other. This is expected to be effective biologically, because the virus is spread by aerosol droplets, and keeping people apart reduces the risk of infection (eg. 1 m when breathing, 2 m when sneezing, 4 m when coughing).
However, lock-downs have not been universal. In particular, Sweden has become well-known for leaving social distancing as a voluntary exercise, although along with strict recommendations — see my post: Media misunderstandings about the coronavirus in Sweden for an explanation of the actual situation. The essential difference is between a government mandated and enforced response and a response based on social co-operation.
The economic consequences of lock-downs have been very serious, and we have constant media reports about how dire the situation has been for various industries. So, it is interesting to compare the spread of the virus in Sweden with the spread elsewhere, as a simple means of estimating how effective the lock-downs have been.
One possible comparison is with the United Kingdom. The pandemic started in both countries at the same time (first reports on 26-27 February), and the current total death rates (attributed to Covid-19) are similar (Sweden: 576 people per million, UK: 611 people per million). The case rates are quite different, however (Sweden: 8,305 people per million, UK: 4,897 people per million), and this might be attributed to the two different strategies. [Note: the USA also has a similar death rate (564 per million) but a much high case rate (18,495 per million).]
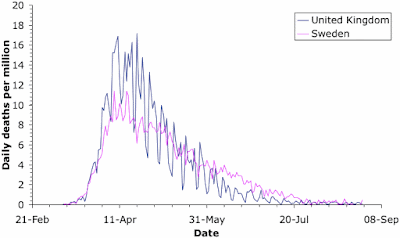
For a meaningful comparison, we need to look at the rates, not the raw data, because the two populations are very different in size (Sweden; 10 million, UK: 68 million). These two graphs show the case rate and death rate through time for the two countries. The comparison is quite revealing. [Note: the saw-tooth patterns in the graphs come from the fact that medical reports in most countries are notably fewer on weekends.]
As expected, the cases initially increased faster in Sweden. However, the case rates were very similar in the two countries by the last week of March; and they remained so until Sweden started serious virus-testing in late May. Just at the moment, the case-rates are similar again, although the UK has actually done twice as much virus testing as Sweden (240,000 tests per million people versus 110,000). Anyway, the two different government responses did not produce much difference in the number of cases for the first 3 months of the pandemic.
The death rates show quite a different pattern. The rates started off very similar, but by the end of March the UK actually had a higher death rate than Sweden. This situation was maintained until the end of May, after which Sweden had the higher rate until the end of July. Once again, the two countries are now very similar. Overall, the time-course of deaths is highly correlated between the two countries (79% shared variation), while the case rates are not (7%).
Of particular note here is that the differences in case rates have not resulted in differences in death rates. Apparently, Sweden's voluntary response has allowed a greater proportion of the population to become infected but this has not resulted in more deaths. I am fairly sure that the authorities will attribute this to the development of herd immunity (which I will talk about in my next post on the coronavirus) (WHO expert praises Swedish strategy - urges other countries to follow suit). [Note: a direct comparison with the USA would be pointless, given the geographical variation discussed above.]
The consequences are far-reaching. As but one example of the unfortunate consequences of the UK lock-down, you could read up on the fiasco concerning the final-year school exams (A coronavirus lesson about the modern state) — without a lock-down, Sweden avoided such problems for its young people.
Conclusion
There is a wealth of data in this pandemic, enough to keep data analysts busy for a very long time. I am sure that we will be inundated with reports for many years to come. In the meantime, like all pandemics, the geography of the local epidemics is a vital point in implementing effective control strategies.


No comments:
Post a Comment