Showing posts with label Haplotype network. Show all posts

Monday, May 4, 2015

A geek network


I have noted before that many of the diagrams on the web purporting to show "evolution" actually show transformational evolution rather than variational evolution, as is done in biology and the historical social sciences (eg. Non-phylogenetic trees; Evolution and timelines; The evolutionary March of Progress in popular culture).

This diagram seems to be an improvement, however. Perhaps its geekiness is responsible for this?


This is an evolutionary network because it is rooted, at "Geekus Prime". You will note that it is a population network rather than strictly a phylogenetic network. That is, many of the internal nodes are labeled with extant taxa, so that both ancestors and their descendants appear. It is a network rather than a tree, because the "World of Warcraft Geek" is a hybrid between the "Dungeons and Dragons Geek" and the ancestor of the "Video Game Geek".

Wednesday, April 8, 2015

Using networks, not trees, to display hybrids


Phylogenetic networks are intended to display reticulate evolutionary histories, rather than strictly divergent or transformational histories. This idea applies both to species and higher taxa (where the ancestors might be inferred), and to individuals and populations (where some of the ancestors might be sampled). However, the literature is still replete with studies that use one or more phylogenetic trees for displaying reticulate phylogenies.

A recent example is shown by: Umer Chaudhry, Elizabeth M. Redman, Muhammad Abbas, Raman Muthusamy, Kamran Ashraf, John S. Gilleard (2015) Genetic evidence for hybridisation between Haemonchus contortus and Haemonchus placei in natural field populations and its implications for interspecies transmission of anthelmintic resistance. International Journal for Parasitology 45: 149-159.

These authors sampled nematode parasites from sheep, goats, cattle and buffaloes at abattoirs in Pakistan and southern India. These parasites were morphologically characterized as being predominantly either Haemonchus contortus or Haemonchus placei. The worms were then genotyped in several ways, including: SNPs of rDNA ITS-2, microsatellite markers, sequences of nuclear isotype-1 of β-tubulin, and sequences of mitochondrial NADH dehydrogenase subunit 4. The genotyping revealed several individual worms that were considered to be inter-species F1 hybrids.

The phylogenetic tree from the β-tubulin sequences is shown in the first figure. There were 25 haplotypes identified among the worms. Most of the worms were homozygous, with haplotypes that were identified as either H. contortus or H. placei. However, five worms were discovered to be heterozygous, with one haplotype considered to have come from each of the species.


The hybrid status of the worms is shown in the phylogenetic tree by having the hybrids appear twice, once for each of their haplotypes, with the other worms appearing only once. Thus, the actual reticulate history is not made visually obvious.

A better approach would be to use a phylogenetic network. This is straightforward in this case. From the perspective of the worms (rather than the haplotypes), the phylogenetic tree is a so-called MUL-tree, in which some of the taxon labels appear multiple times (and some appear only once). The labels that appear once represent homozygous worms, which can be seen as being "monoploid" for this locus. The labels that appear twice represent heterozygous worms, which can be seen as being "diploid".

MUL-trees where the labels represent different ploidy levels can easily be turned into a network using the Padre program. The result is shown in the next figure, which is therefore a hybridization network.


The actual history of the worms is now clear. Interestingly, one of the hybridization events seems to be older than the other four.

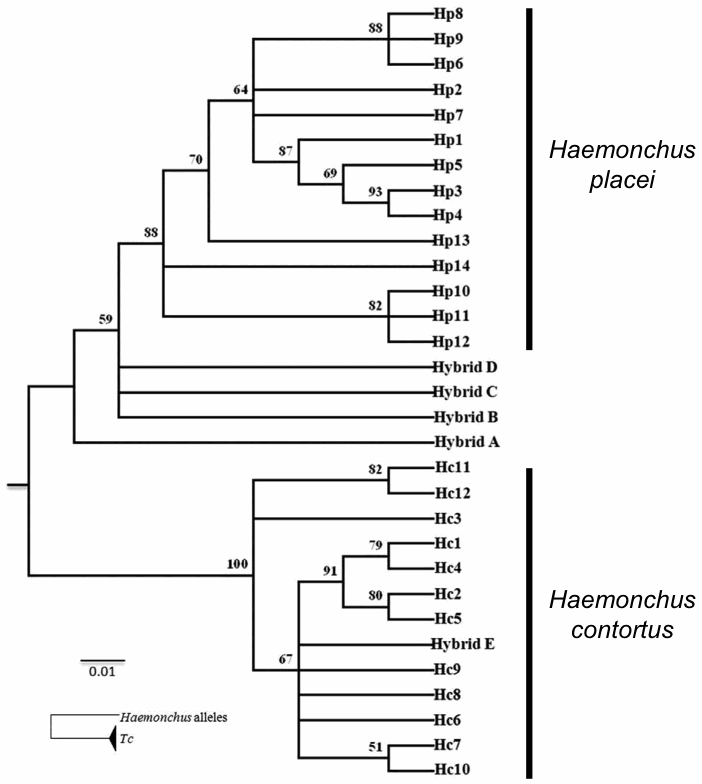
As an aside, it is also worth pointing out a mis-interpretation of the phylogenetic tree produced from the mitochondrial ND4 sequences. This tree is shown in the next figure — I have added the annotations at the right.


The phylogeny shows 12 haplotypes considered to be H. contortus and 14 haplotypes considered to be H. placei. One of the hybrids clearly has a H. contortus haplotype, indicating that its maternal parent came from this species. However, the other four hybrids cannot be unequivocally identified as having H. placei mothers (as claimed by the authors), as their haplotypes are all sisters to the H. placei haplotypes — all of the H. placei haplotypes share a common ancestor that is not shared with the hybrids. Given the root of the tree, H. placei is a more likely identification than is H. contortus, but the tree does not provide unequivocal evidence.

Wednesday, November 27, 2013

Within-species networks


In this blog we have consistently championed the idea that within-species relationships are better represented by a network than by a tree. We have done this for humans and their relatives:
Networks and human inter-population variation
Human races, networks and fuzzy clusters
Why do we still use trees for the Neandertal genealogy?
and for other species as well:
Are phylogenetic trees useful for domesticated organisms?
Why do we still use trees for the dog genealogy?
Network of apple cultivars
Genetically, a within-species network is a haplotype network. Also, when dealing with individuals in a sexually reproducing species it is a hybridization network, as I have noted:
Family trees, pedigrees and hybridization networks
Charles Darwin's family pedigree network
Toulouse-Lautrec: family trees and networks
We are not the only blog to emphasize intra-species networks, of course. As far as humans are concerned, one of the more vocal blogs has been Gene Expression, run by Razib Khan over at Discover magazine. For example, when discussing phylogenetic trees (Burning down the trees in historical population genetics), Khan notes:
These sorts of trees range from Ernst Haeckel's classical attempt, depicting relationships which biologists derived from intuition within the framework of a grand evolutionary scheme, all the way down to modern methods implemented in software packages such as Mr. Bayes, which many frankly utilize in a "turnkey" manner. These trees are abstractions, in that they reduce down a wide range of phenomena into schematic representations which impart aspects of particular interest in a stylized form. This is important, because the actual nature of the phenomena being represented may be more complex than is being represented.
Phylogenetic analysis involving distinct species has its own problems, but they are dwarfed by what must confront those who attempt to parse out relatedness of populations within species. Because of the ubiquity of gene flow across populations within species, attempts to generate a tree of relationships of populations is always bound to be a gross simplification. Instead of a sequence of bifurcations the true relationship of putative populations is more accurately represented by a networked graph.
When discussing alternative evolutionary models (Unveiling the genealogical lattice), Khan notes:
It seems that the bifurcating model of the tree must now be strongly tinted by the shades of reticulation. In a stylized sense inter-specific phylogenies, which assume the approximate truth of the biological species concept (i.e., little gene flow across lineages), mislead us when we think of the phylogeny of species on the microevolutionary scale of population genetics. On an intra-specific scale gene flow is not just a nuisance parameter in the model, it is an essential phenomenon which must be accommodated into the framework.
And here the takeaway for me is that we may need to rethink our whole conception of pure ancestral populations, and imagine a human phylogenetic tree as a series of lattices in eternal flux, with admixed nodes periodically expanding so as to generate the artifice of a diversifying tree. The closer we look, the more likely it seems that most of the populations which have undergone demographic expansion in the past 10,000 years are also the products of admixture. Any story of the past 10,000 years, and likely the past 100,000 years, must give space at the center of the narrative arc to lateral gene flow across populations.
Mind you, the network and lattice metaphors are not the only ones he has up his sleeve (When trees turn into brambles):
With the expansion of genomics from humans to a wide range of species I suspect that we’ll see a lot more blurring of distinctions between species on the margins. This will be particularly true of those lineages with wide and continuous distributions. It will also be most salient and surprising for mammalian populations, where our prejudices about the primacy of a biological species concept are most strongly developed. In a phylogenetic sense when you shift the grain of analysis to a finer scale the tree of life becomes much more of a bramble in many cases.
Indeed.

Wednesday, October 2, 2013

Reticulation patterns and processes in phylogenetic networks


When it comes to phylogenetic networks, there is often misunderstanding between biological and computational scientists, because the former tend to focus on the biological processes underlying the network whereas the latter focus on the patterns needing to be analyzed to produce the networks.

Here, I try to provide a summary of the different processes and patterns involved in reticulation, so that both "sides" get an overview, and hopefully can communicate more easily. I am principally discussing the development of networks that display evolutionary history.

In phylogenetics, historical processes create contemporary patterns, and we then try to detect those patterns, and assess them in order to determine what process created each pattern. Computationally, algorithms will detect certain data patterns and display them in a directed acyclic graph, which is then interpreted biologically. What needs to happen is for us to identify the possible patterns created by the different processes, so that algorithms can be developed that will detect them. It is doubtful that an algorithm will be able to identify all individual processes — it will be up to biologists to work out what process created each pattern detected.

In what follows, there are major simplifications from both the biological and computational points of view, so please be aware of that. In particular, note that I have not discussed either deep coalescence or gene duplication-loss which, if present, will confound the detection of reticulation patterns.

Hybridization (hybrid speciation)

This is the formation of a new species via sexual reproduction. There are two basic forms that are of interest:
Homoploid Hybridization, in which one copy of the genome is inherited from each parent species (eg. diploid parents create a diploid hybrid);
Polyploid Hybridization, in which multiple copies of the genome are inherited from each parent species (eg. diploid parents create a polyploid hybrid).


Polyploid hybridization is usually assessed by sequencing each copy of the genome in the hybrid species, and treating each copy as a terminal in the data analysis, This produces a multi-labelled genome tree, which is then turned into a single-labelled species network.

At the species level, homoploid hybridization is usually assessed by sequencing several genes in the hybrid species (often from both the nuclear and non-nuclear genomes) and producing independent gene trees. The species network is created by resolving conflicts among the gene trees. This form of analysis assumes a data pattern that is very similar to that of HGT.

In population studies, homoploid hybridization is usually assessed at the sequence level, using multiple-copy nuclear genes, where hybrids are detected by additive polymorphisms at some alignment positions.

Introgression (introgressive hybridization)

This is the transfer of genetic material from one species to another via sexual reproduction. This happens when hybrid individuals back-cross preferentially to one of the parental species, rather than forming a new hybrid species. It can involve anything from 1-49% of the genome (at 50% it is best called hybridization). The data pattern created is very similar to that of HGT (the transfer of genetic material from one species to another via non-sexual means).


It is usually assessed at the population level, by sequencing one or more genes (often from both the nuclear and non-nuclear genomes) from many individuals, and demonstrating that identical haplotypes (haploid genotypes) occur in what are recognized as separate species. This is done by constructing a haplotype network. Often, individuals are detected where the non-nuclear haplotype differs from the nuclear haplotype (as shown in the figure).

Horizontal Gene Transfer

This is the transfer of genetic material from one species to another via non-sexual means (eg. transformation, transduction, or conjugation). The data pattern created is very similar to that of introgression (the transfer of genetic material from one species to another via sexual reproduction).

It is sometimes assessed by sequencing several genes and producing independent gene trees. The species network is created by resolving conflicts among the gene trees. This form of analysis assumes data that are very similar to those of homoploid hybridization or recombination.

Alternatively, it is often assessed by comparing gene trees to a species tree (either pre-specified, or derived from multi-gene data). The species network is created by resolving conflicts between the gene trees and the species tree.

Homologous Recombination and Viral Reassortment

These involve homologous parts of a genome breaking part and re-arranging themselves, often during sexual reproduction. With cross-over the two genomes exchange material, and with gene conversion one genome acquires material from the other. There are three basic forms that are of interest:
Intra-genic Recombination, in which the break-points occur within a single gene;
Inter-genic Recombination, in which the break-points occur in different genes or non-coding spaces between genes;
Reassortment, in which segmented viruses re-combine their segments to create new strains (similar to gene conversion); this is basically inter-genic recombination without sex.


Intra-genic recombination is usually analyzed at the sequence level, based on ordered data. The gene network is constructed by identifying break-points, and thus the recombined segments. It is also possible for one of the donors of a recombined sequence to be missing from the dataset, in which case the data pattern will be the same as for HGT without the donor sampled.

Inter-genic recombination will produce the same pattern as hybridization, if both break-points are outside the region sequenced. Furthermore, homoploid hybridization can be thought of as recombination of whole chromosomes.

Viral reassortment is usually assessed by comparing strains with each other based on presence-absence of segmental haplotypes (rather similar to haplotyping of sexual organisms). This is a unique form of analysis, and it can produce incredibly complex networks.

Summary

Process

Polyploid hybridization (species)
Homoploid hybridization (species)
Homoploid hybridization (population)

Introgression (population)

Horizontal gene transfer (species)


Intra-genic recombination
Inter-genic recombination
Reassortment (population)
Evaluation method

multi-labelled tree
incongruent gene trees
sequence additive polymorphisms

haplotype network

incongruent gene trees
incongruent gene/species trees

sequence break-points
incongruent gene trees
haplotype network

It may be impossible ever to reliably distinguish homoploid hybridization, introgression, HGT and inter-genic recombination from each other by pattern analysis alone, at least not without genome-scale data.

Wednesday, September 25, 2013

How do we interpret a rooted haplotype network?


A splits graph is an unrooted phylogenetic network (see How to interpret splits graphs). It can be produced by any of several algorithms, including distance-based methods such as NeighborNet and Split Decomposition, character-based methods such as Median Networks and Parsimony Splits, and tree-based methods such as Consensus Networks and SuperNetworks.

Such graphs can also be produced by methods that conceptually modify Median Networks, such as Reduced Median Networks and Median-Joining Networks. These two methods are popular in population genetics, especially as related to Homo sapiens, where they are used as haplotype networks (or 1-step networks); and it is their use as haplotype networks that I wish to discuss here.

Haplotype networks represent the relationships among the different haploid genotypes observed in the dataset (ie. identical sequences are pooled into a single terminal). They are usually drawn unrooted, which is quite sensible for within-species data, where the root location is often unknown. However, there are occasions when a root is provided, and authors then interpret the splits graph as a directed network. This is directly analogous to starting with an unrooted phylogenetic tree and adding a root (usually via an outgroup), so that the rooted tree can be interpreted as a genealogical history. In moving from an unrooted to a rooted tree, each branch acquires a direction (away from the root), and the internal nodes become hypothetical ancestors.

However, this is problematic for all types of unrooted network. In the case of splits graphs, each edge acquires an unambiguous direction, as for a tree, but not every internal node can necessarily be interpreted as a hypothetical ancestor. How, then, do we interpret the rooted haplotype network?

An example

Let's look at a specific example, taken from the recent paper by Witas et al. (2013).


Figure 4 from this paper shows a haplotype network of four mtDNA HVR1 (hypervariable region 1 of the control region) samples from Ancient Mesopotamia (the middle Euphrates valley between 2500 BC and 500 AD), compared to contemporary samples from five different geographical regions. It shows that the ancient samples fit neatly into modern genetic variation from southern and eastern Asia, rather than from eastern Europe.

However, note that a root is also explicitly indicated. I explain below where this root comes from, but first let's concentrate on what happens if we treat the network as rooted.


This is a Median-Joining Network, and thus it is a splits graph. As such, the root provides unambiguous directions for all of the branches, based on the principle that the network must be a directed acyclic graph with only one root. This is shown by the arrows in the modified figure. Furthermore, all of the internal nodes can be interpreted as a hypothetical ancestors, except for the two reticulations in the graph, labelled A and B.

These reticulations are created by contradictory patterns involving the characters labelled 16276, 16185 and 16311. In a rooted splits graph, reticulations represent uncertainty about the order of character changes, rather than representing reticulate evolution (eg. recombination, hybridization, etc). In this case, we cannot determine whether character 16311 changes before or after the changes in characters 16185 and 16276.

So, it is important to recognize that a rooted splits graph does not explicitly represent a phylogeny, because reticulations in the graph represent uncertainty not genealogy.

The simplest interpretation of a this type of rooted splits graph is usually that the network represents a set of most-parsimonious trees, rather than a single parsimony tree. The different trees can be obtained by resolving the reticulations (ie. by deciding what order the character changes occur in). This relationship between the rooted haplotype network and a parsimony tree is shown by the following example from Jansen et al. (2002).


This is a network of 93 mtDNA control-region haplotypes from horses. It is also a Median-Joining Network, although the data were pre-processed using a Reduced Median Network. Node A6 is the root, based on equid outgroups. The solid lines indicates one of the most-parsimonious trees contained within the network — for every reticulation, one particular order of the character changes has been selected by the authors in order to postulate this particular tree. The non-chosen parts of the network are indicated by dotted lines — these are part of alternative most-parsimonious trees.

Explanation of the human mtDNA root

mtDNA is usually treated as a non-recombining locus, and so it should evolve along a tree. A rooted global tree has therefore been produced for humans, based on parsimony analysis of the mtDNA genome (Torroni et al. 2000; van Oven and Kayser 2009). Groups and subgroups of this tree have been labelled as haplotypes, such as haplotype group M shown in the top figure, and sub-haplogroups, such as M4b, M49 and M61. These are (monophyletic) clades in the mtDNA tree that have been highlighted for convenience. Parsimony analysis has been used to reconstruct the ancestral sequences in the tree (Behar et al. 2012), and these ancestral sequences can be used to assign new sequences to their appropriate place in the rooted tree (Blanco et al. 2011).

The basic limitation of this approach is that the haplogroups and sub-haplogroups are based on a non-unique parsimony tree. There are many equally parsimonious trees for the dataset, any one of which could have been chosen to define the haplogroups. In spite of this limitation, the predefined haplogroups are treated by many people as actually designating specific mitochondrial lineages, rather than merely being groups of convenience, which is what they are.

References

Behar DM, van Oven M, Rosset S, Metspalu M, Loogväli EL, Silva NM, Kivisild T, Torroni A, Villems R (2012) A "Copernican" reassessment of the human mitochondrial DNA tree from its root. American Journal of Human Genetics 90: 675-684.

Blanco R, Mayordomo E, Montoya J, Ruiz-Pesini E (2011) Rebooting the human mitochondrial phylogeny: an automated and scalable methodology with expert knowledge. BMC Bioinformatics 12: 174.

Jansen T, Forster P, Levine MA, Oelke H, Hurles M, Renfrew C, Weber J, Olek K (2002) Mitochondrial DNA and the origins of the domestic horse. Proc Natl Acad Sci USA 99: 10905-10910.

Torroni A, Achilli A, Macaulay V, Richards M, Bandelt H-J (2000) Harvesting the fruit of the human mtDNA tree. Trends in Genetics 22: 339-345.

van Oven M, Kayser M (2009) Updated comprehensive phylogenetic tree of global human mitochondrial DNA variation. Human Mutation 30: E386-E394.

Witas HW, Tomczyk J, Jędrychowska-Dańska K, Chaubey G, Płoszaj T (2013) mtDNA from the Early Bronze Age to the Roman period suggests a genetic link between the Indian subcontinent and Mesopotamian cradle of civilization. PLoS One 8(9): e73682.

Wednesday, June 20, 2012

Rooted networks for exploratory data analysis


Leo van Iersel has recently been trying to convince me that rooted networks might also be useful as exploratory data analysis (EDA), in addition to the unrooted networks that I have championed in print (Morrison 2010) and in this blog. I have tried to find a dataset that will support his case, and the one discussed here is the best that I have been able to find.

In infection biology we are interested in the transmission of pathogens from one host to another, possibly in geographically distant locations. It is usually assumed that pathogens (viruses, bacteria, protists, microfungi, helminths) with the same genotype found in different locations represent transmission from a single source location. Conversely, a mixture of genotypes at a single location is assumed to represent multiple sources of infection, possibly at different times. This type of analysis is a combination of population genetics and phylogenetics.

Such transmission studies can produce quite complex results, even to the extent of having different pathogen genotypes simultaneously in the same host. Data analysis is usually based on either a rooted tree or an unrooted haplotype network, but it can also conveniently be studied using a rooted reticulation network. I will illustrate the latter with a simple example.

Click to enlarge

The figure shows a rooted network for 1,544 aligned nucleotides from 72 samples of the nematode Dictyocaulus viviparus, which is the parasitic lungworm of domestic cattle. The data are concatenated mitochondrial protein (2 genes), rRNA and tRNA gene sequences, from Höglund et al. (2006). The analysis shows the inferred historical relationships among 64 farm samples from Sweden (8 worms from each of Farms 29, 34, 36, 38, 49, 65, 68 and 76) and 8 samples from a isolate that had been maintained in the laboratory (L, used as the outgroup to root the network).

The data have been analyzed using the reticulation network method of Huson et al. (2007), based on splits generated by the Median network. Since the character data are essentially binary (with two exceptions), this produces exactly the same result as for a recombination network.

In the network, most of the samples from within each farm seem to be closely related in a simple divergent fashion through time, as would also be conveniently displayed by a standard tree-based analysis. There are apparently two major clades of genotypes, with 6-7 subclades. We can conclude from the tree-like relationships that four farms show evidence of only a single source of infection (Farms 34, 36, 38 and 76 each have a single genotype), while two farms appear to have at least two genotypes and thus probably two sources of infection (Farms 49 and 68).

However, two of the farms show more complex patterns than these, which would not be revealed by a simple tree analysis. These two farms have groups of samples that descend from reticulation nodes (indicated by the arrows), thus suggesting the pooling of two distinct sources of genetic material. Note that there is no suggestion that these reticulations represent either recombination or hybridization, given that the data are from mitochondrial genes. This analysis is best treated as exploratory (EDA), highlighting genotypic complexity that warrants further biological investigation, rather then providing an explicit hypothesis of evolutionary history.

Farm 29 is shown as having one unique genotype (5 individuals) plus another genotype (3 individuals) that has elements possibly related to both of the major clades of genotypes. Perhaps these latter 3 individuals represent an earlier infection, given their apparent association with the basal branches of the two clades.

Farm 65 appears to be even more noteworthy. There are 3 individuals that are apparently related to those on Farm 36, plus 3 individuals of somewhat uncertain relationship. Then there are 2 individuals with elements possibly related to the genotypes on Farms 76 and 49. This is clearly a very interesting farm, from the point of view of lungworm infection and transmission, with at least three possible infection sources. This is important information that needs to be taken into account for possible management strategies.

This use of a rooted network analysis for exploratory data analysis seems not to have been considered before. However, it seems to me that it adds considerably to the practical information that can be gleaned from a study of the transmission of pathogens.

References

Höglund J., Morrison D.A., Mattsson J.G., Engström A. (2006) Population genetics of the bovine/cattle lungworm (Dictyocaulus viviparus) based on mtDNA and AFLP marker techniques. Parasitology 133: 89-99.

Huson D.H., Klöpper T.H. (2007) Beyond galled trees — decomposition and computation of galled networks. Lecture Notes in Bioinformatics 4453: 211-225.

Morrison D.A. (2010) Using data-display networks for exploratory data analysis in phylogenetic studies. Molecular Biology and Evolution 27: 1044-1057.

Wednesday, March 7, 2012

Why do we still use trees for the dog genealogy?


In my previous two posts on Georges-Louis Leclerc, comte de Buffon, and his original dog genealogy of 1755, and the model for it, my interest was in Buffon's pioneering spirit in developing new ideas about genealogies and their presentation. However, it also seems natural to wonder how much we have progressed in the 250 years since then.

Having looked at the recent literature, there currently seem to be three distinct trends within dog phylogenetics:
  1. the study of whole-genome data, in which the results are presented solely as a neighbor-joining tree
      Parker et al. (2004)
      von Holdt et al. (2010)
  2. the study of mtDNA sequence data, in which the results are presented both as a tree and as a haplotype network
      Brown et al. (2011)
      Kropatsch et al. (2011)
      Oskarsson et al. (2012)
      Ryabinina (2006)
  3. the study of combined Y-chromosome and mtDNA sequence data, in which the results are presented solely as a haplotype network
      Leonard et al. (2002)
      Li et al. (2011)
      Pires et al. (2006)
      Savolainen et al. (2002)
      Savolainen et al. (2004)
      Sundqvist et al. (2006)
      Verginelli et al. (2005)
It is difficult to look at this list and not feel that there is a great deal of historical inertia here, regarding the choice of analysis method. People like Hans Bandelt have developed network methods explicitly for mtDNA data, such as median-joining and reduced-median networks; and the literature is replete with papers using these methods to analyze mtDNA sequences, especially the so-called "mitochondrial control region". On the other hand, these methods seem to be less commonly employed for other data types, where instead trees are de rigeur. So, people are apparently choosing their analyses based on historical convention within their field, rather than their suitability for the purposes at hand. Perhaps the papers where both methods are used should be seen as a compromise? Or should I be optimistic and see tham as part of a move away from trees towards the use of networks?

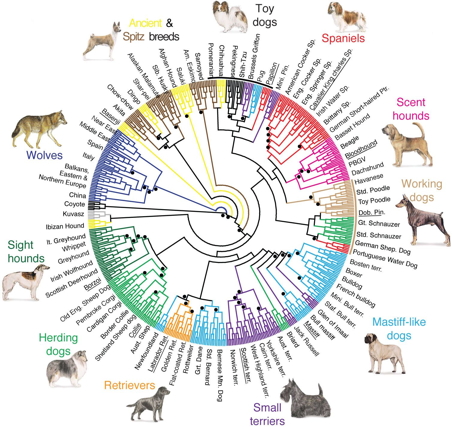
I have shown the two dog trees here. Both of them make it abundantly clear, even to the casual observer, that a tree is inappropriate for the data at hand.

Dog phylogeny (Parker et al. 2004) [Click to view]

The tree from Parker et al. has extremely small bootstrap values for almost all of the branches (only those >50% are shown on the tree), and even the group of modern dog breeds does not get up to 50% support. Clearly, there is massive conflict in this dataset. [Do not ask me why there is a value of 100% for the single branch at the base of the tree, since its presence is illogical.]

Dog phylogeny (von Holdt et al. 2010)

The tree from von Holdt et al. has broader coverage but is even more clearly non-tree-like. The dots indicate the branches with >95% bootstrap support and the colours indicate the 10 groups of dog breeds recognized by the Fédération Cynologique Internationale. As you can see, many of the breeds are scattered around the genetic tree, indicating cross-breeding in the genealogical history. This paper thus follows Buffon by nominating representative breed groups but fails by not showing the cross-breeding. So, it is drawn as a tree not a network, even when we know the history is not a tree. The use of colouring in the phylogenetic tree is one interesting way to indicate cross-connections in the genealogy, but cross-connecting lines is more explicit. [Interestingly, later editions of Buffon's work sometimes used hand-colouring of the genealogy to emphasize the breed groups that Buffon discusses in his text, so even this is not original.]

In both of these cases the tree analysis seems wildly inappropriate. As Buffon wisely told us 250 years ago, domestic dog breeds do not have a simple tree-like ancestry. It almost seems insulting that 2.5 centuries later we are still trying to fit these very same breeds (plus their numerous more-recent descendant breeds) into the straightjacket of a tree. We need to learn from the past if we are to progress into the future.

By the way, the patterns discussed here for phylogenetic analysis seem to be true for all groups of domesticated organisms. [You could try searching for the horse genealogy on the web, and you will see what I mean.] I am thus using the dogs merely as one convenient example. Following Andersen (1990), I do not intend "to pillory the few for errors which many commit with impunity".

Added note:
Since writing this post, another paper has appeared that can be added to group 1 (whole-genome data, with the results presented solely as a neighbor-joining tree): Larson et al. (2012).

References

Andersen B. (1990) Methodological Errors in Medical Research: an Incomplete Catalogue. Blackwell Science, Oxford.

Brown S.K. et al. (2011) Phylogenetic distinctiveness of Middle Eastern and Southeast Asian village dog Y chromosomes illuminates dog origins. PLoS One 6(12): e28496.

Kropatsch R. et al. (2011) On ancestors of dog breeds with focus on Weimaraner hunting dogs. Journal of Animal Breeding and Genetics 128: 64–72.

Larson G et al. (2012) Rethinking dog domestication by integrating genetics, archeology, and biogeography. Proc Natl Acad Sci USA 109: 8878-8883.

Leonard J.A. et al. (2002) Ancient DNA evidence for Old World origin of New World dogs. Science 298: 1613–1616.

Li Y. et al. (2011) The origin of the Tibetan Mastiff and species identification of Canis based on mitochondrial cytochrome c oxidase subunit I (COI) gene and COI barcoding. Animal 5: 1868-1873.

Oskarsson M.C.R. et al. (2012) Mitochondrial DNA data indicate an introduction through mainland Southeast Asia for Australian dingoes and Polynesian domestic dogs. Proceedings of the Royal Society B 279: 967-974.
Parker G. et al. (2004) Genetic structure of the purebred domestic dog. Science 304: 1160-1164.

Pires A.L. et al. (2006) Mitochondrial DNA sequence variation in Portuguese native dog breeds: diversity and phylogenetic affinities. Journal of Heredity 97: 318-330.

Ryabinina O.M. (2006) Genetic diversity and phylogenetic relationships in groups of Asian Guardian, Siberian Hunting and European Shepherd dog breeds. Proceedings of the Fifth International Conference on Bioinformatics of Genome Regulation and Structure, Volume 3, 50.

Savolainen P. et al. (2002) Genetic evidence for an East Asian origin of domestic dogs. Science 298: 1610–1613.

Savolainen P. et al. (2004) A detailed picture of the origin of the Australian dingo, obtained from the study of mitochondrial DNA. Proc Natl Acad Sci USA 101: 12387-12390.

Sundqvist A.-K. et al. (2006) Unequal contribution of sexes in the origin of dog breeds. Genetics 172: 1121–1128.

Verginelli F. et al. (2005) Mitochondrial DNA from prehistoric canids highlights relationships between dogs and south-east European wolves. Molecular Biology & Evolution 22: 2541-2551.

von Holdt B.M. et al. (2010) Genome-wide SNP and haplotype analyses reveal a rich history underlying dog domestication. Nature 464: 898-902.