Showing posts with label Recombination network. Show all posts

Monday, March 16, 2020

Problems with the phylogeny of coronaviruses


Coronaviruses are much in the news at the moment. Indeed, one particular variant seems to be the major news topic as I write this post. This is the one known as 2019-nCoV or SARS-CoV-2, which is responsible for the human pneumonia called COVID-19.

Obviously, the main issue for the public is infection biology, particularly the apparent ease with which the virus can spread in human populations. Part of the issue here seems to be that human coronaviruses are covered with a lipid membrane, which means that they "can remain infectious on inanimate surfaces [like metal, glass or plastic] at room temperature for up to 9 days" (Kampf et al. 2020), which dramatically increases the probability of each of us encountering one.

There is now a decline in reported cases in China, but there may a resurgence. The problem is that an infected person may show no symptoms, or only very mild ones, and thus never report themselves. So, there may be millions more infected people running around the country, ready to infect new people when the travel restrictions are lifted, and the unexposed people come in contact with them. Biologically, the only safety is immunization, which occurs when you are exposed to the virus — which is risky, of course.

From Forni et al. (2017). Click to enlarge.

There will obviously be a lot of political fall-out in coming weeks, with various governments being accused of not doing enough and others of doing too much. The widespread infections in South Korea seem to be the result of a secretive religious organization (responsible for more than 60% of the national infections), to which the government has responded better than most others. On the other hand, in Iran it seems to be government that has been the major problem, hiding the initial infections because of their potential affect on impending elections.

In Italy, the country seems to have been overwhelmed, and the death rate is very high, while in Germany the infection rate is relatively high but the death rate is currently still low. Indeed, Italy's long-delayed "lock-down" on internal travel contrasts strongly with China's much more rapid response, and this seems to be reflected in vastly different infection rates (Italy currently has 6x the number infections per million people). More than a half of the cases to date where I live, in Sweden, came initially from northern Italy, with most of the rest from Austria, which are popular downhill-skiing destinations at this time of the year.

Phylogenetics

However, for our purposes here it is the phylogenetics of coronaviruses that is of professional interest, not infection biology. This has been a research topic for the past couple of decades, with the origin of several novel coronavirus strains in humans during that time (see the timeline above). These include SARS-CoV (causing Severe Acute Respiratory Syndrome) and MERS-CoV (causing Middle East Respiratory Syndrome) — both of these have much higher fatality rates than the current epidemic (10% and 34%, respectively), but lower rates of spread. A selected set of relevant papers is listed below; and I have included a couple of phylogenies as examples.

The issue that I wish to mention here is that there appears to be a disconnection between the so-called phylogenies presented in these papers and the concept of a phylogenetic history. The papers present either a rooted or an unrooted tree. In the first case, this simply represents a set of clusters based on genomic similarity. In the second case, this represents a hierarchical grouping based on genomic similarity. Obviously, an unrooted tree cannot represent a phylogenetic history, since evolution has a time direction, and this can only be illustrated using a directed (ie. rooted) tree or network.

However, the bigger issue is that these trees cannot represent an actual virus phylogeny. The argument for presenting them seems to be that the clusters / groups are based on genomic similarity, which in turn is caused by the phylogenetic history of the viruses. This is true, but we cannot thereby invert the logic. Phylogenetics creates similarity, but mere similarity does not necessarily represent phylogenetic history.

In the case of coronaviruses, the evolutionary history is reported to involve extensive genomic recombination in the formation of novel strains (reviewed by Cui et al. 2019). That is, during an epidemic the phylogeny might be tree-like, but at the origin of the epidemic it is not. This especially occurs because coronaviruses can infect a range of hosts (not just humans), and it is the recombination that occurs while within one host that allows novel strains to appear that can create epidemics in a different host.

This is also prevalent in, for example, influenza viruses (which also have a lipid membrane). This occurred for the world's worst epidemic (c. 500 million affected), the so-called Spanish Flu of 1918-1920, which actually started in the USA. The current most-likely explanation is that both a bird-host and a human-host influenza strain got into a pig, recombined in the cells of that host, and then the new virus strain got back into the human population.

Therefore the full phylogenetic history cannot be tree-like. Indeed, the actual history must be in the form of a recombination network, as discussed elsewhere in this blog. So, the trees, as shown in the papers below, represent the similarity of the coronaviruses but not all of their phylogeny. For the latter, we need a haplotype network representation, as illustrated in this example:

Some small haplotype networks; from Yu et al. (2020)

It would be interesting to construct a recombination network based on the data from one or more of the coronavirus papers, as an example. However, as far as I can see, none of the authors has referred to an online version of their genomic alignment; and so I cannot present such a thing here.

Literature

Cui J, Li F, Shi Z-L (2019) Origin and evolution of pathogenic coronaviruses. Nature Reviews Microbiology 17: 181-192.

Chen Y, Liu Q, Guo D (2020) Emerging coronaviruses: genome structure, replication, and pathogenesis. Journal of Medical Virology 92: 418-423.

Eickmann M et al. (2003) Phylogeny of the SARS coronavirus. Science 302: 1504-1505.

Forni D, Cagliani R, Clerici M, Sironi M (2017) Molecular evolution of human coronavirus genomes Trends in Microbiology 25: 35-48.

Gorbalenya AE, Snijder EJ, Spaan WJ (2004) Severe acute respiratory syndrome coronavirus phylogeny: toward consensus. Journal of Virology 8: 7863-7866.

Kampf G, Todt D, Pfaender S, Steinmann E (2020) Persistence of coronaviruses on inanimate surfaces and their inactivation with biocidal agents. Journal of Hospital Infection 104: 246-251.

Luk HKH, Li X, Fung J, Lau SKP, Woo PCY (2019) Molecular epidemiology, evolution and phylogeny of SARS coronavirus. Infection Genetics and Evolution 71: 21-30.

Woo PC, Lau SK, Huang Y, Yuen KY (2009) Coronavirus diversity, phylogeny and interspecies jumping. Experimental Biology and Medicine 234: 1117-1127.

Yu WB, Tang G-D, Zhang L, Corlett RT (2020) Decoding evolution and transmissions of novel pneumonia coronavirus (SARS-CoV-2) using the whole genomic data. (ResearchGate)

Zhang L, Shen F-M,Chen F, Lin Z (2020) Origin and evolution of the 2019 novel coronavirus. Clinical Infectious Diseases (Epub ahead of print).

An unrooted tree; from Cui et al. (2019).

A rooted tree; from Chen et al. (2020)

Monday, December 7, 2015

Recent book reviews


In one of the earliest blog posts (Reviews of recent books) I provided links to some book reviews. Recently, a few have appeared for Dan Gusfield's book: ReCombinatorics: the algorithmics of ancestral recombination graphs and explicit phylogenetic networks (2014. The MIT Press, Cambridge, MA).

In addition to the three endorsements that appear as part of the publisher's blurb, a number of independent book reviews have appeared since its publication:

(2014) Computing Reviews Review#143064.

Michael Sanderson (2015) Quarterly Review of Biology 90: 344-345.

Luay Nakhleh (2015) SIAM Reviews 57: 638-642.

From the mathematical point of view, the reviews make it clear that this book is necessary because networks are very much part of the fringe of the computational sciences. Indeed, the challenge is to convince mathematicians that interesting mathematical problems exist with the the study of networks. In this sense, the main limitation of the book is its focus on the parsimony criterion for optimization, rather than statistical approaches to inference, which play such a large part in phylogenetic analyses.

From the biological point of view, the principal issue seems to be the reliance of the book on the infinite sites model, which does not currently have wide applicability in phylogenetics (eg. mostly in population studies such as haplotype inference and association mapping).

The ultimate goal for both computational end biological scientists is working out how to include recombination in the framework of other types of phylogenetic networks. A basic assumption of many phylogenetic analyses is that there has been no recombination. This is because recombination can destroy much of the evidence left by historically preceding processes, so that neither genotype nor phenotype data can reveal patterns and processes that pre-date the recombination events. In this sense, recombination becomes the reticulation process, rather than processes like hybridization or introgression.

Wednesday, September 30, 2015

Are networks actually used to explore reticulate histories?


A look at the modern literature clearly shows that many, if not most, researchers do not use network methods when exploring reticulate evolutionary histories. As examples of the range of possible approaches, I will briefly discuss two papers from a recent journal issue.

Archaic introgression
Pengfei Qin and Mark Stoneking (2015) Denisovan ancestry in East Eurasian and Native American populations. Molecular Biology and Evolution 32: 2665-2674.
The data used for this study of archaic introgression in hominids were genome-wide SNPs from 2,493 modern humans, plus a chimpanzee and two fossils, one from the only known Denisovan individual and one from a Neandertal. The data were reduced to f4 summary statistics, which assess the correlation between the allele frequency differences of two pairs of populations. (If populations A and B are consistent with forming a clade with respect to populations C and D, then the f4 statistic is expected to be 0.) The proportions of introgressions between populations were then calculated as the ratios between selected f4 statistics. Finally, the results of the series of calculations were presented as an admixture (or introgression) network.


There are design problems with this experiment, but at least the authors do use an explicit method to produce the introgression pattern for their phylogenetic network. They do, however, draw the network manually.

The obvious experimental problem is lack of replication, which is a basic requirement of traditional science. In this case, the work is ostensibly about archaic introgression, but there is no replication of the Denisovan, Neandertal or chimpanzee samples, which are the key ones for quantifying archaic patterns. Mind you, there are only a couple of bones of the Denisovan, so the lack of replication is hardly surprising, however regrettable it may be.

There are also technical problems, such as the artifactual arch pattern in the PCA plot (see Distortions and artifacts in Principal Components Analysis analysis of genome data).

Finally, note that the "introgression" arrows in the network do not point from the ostensible source but always from a sister taxon of that source. This is basically the argument that we cannot know ancestors, and so we must represent them as sister taxa to their putative descendants in an evolutionary diagram.

Yeast recombination
Baojun Wu, Adnan Buljic and Weilong Hao (2015) Extensive horizontal transfer and homologous recombination generate highly chimeric mitochondrial genomes in yeast. Molecular Biology and Evolution 32: 2559-2570.
The authors studied aligned sequences of 40 mitochondrial genomes from yeasts, and report "extensive, homologous-recombination-mediated, mitochondrial-to-mitochondrial HGT, leading to genomes that are highly chimeric." Recombination was evaluated using various methods from the RDP4 program. Horizontal gene transfer (HGT) was evaluated by comparing different mitochondrial genome regions (introns as well as exons). No phylogenetic network was presented to summarize the phylogenetic relationships, just a long series of incongruent gene (or locus) trees.

The lack of a network summary of HGT studies is quite common. This is in spite of programs available to evaluate HGT and display the results. The focus in such studies seems to be on mechanisms, instead, rather than on the phylogenetic history.

The general experimental issue with the study of HGT is that evidence for it is solely inference from incongruence: (i) incongruent gene trees must be the result of either incomplete lineage sorting (ILS), gene duplication-loss (DL) or gene flow, and (ii) if it is the latter and the taxa are not closely related, then it is called HGT. This is not particularly evidence, especially when ILS and DL are not explicitly evaluated. These days, there are several methods available for doing this.

Wednesday, May 20, 2015

A limitation of turning splits graphs into reticulate networks


Splits graphs are a useful way of displaying contradictory information within evolutionary datasets, either incompatible characters (ie. those that cannot fit onto a single tree) or incompatible trees. Since the graphs are unrooted, they are usually treated as a form of multivariate data display, rather than interpreted as depicting evolutionary history.

However, it is possible to turn a splits graph into a evolutionary network (sometimes called a reticulation network) once a root is specified (Huson and Klöpper 2007). This is true irrespective of whether the splits are derived from character data (Huson and Kloepper 2005), in which case it usually called a recombination network, or whether they come from a set of trees (Huson et al. 2005), in which case it is usually called a hybridization network.

The SplitsTree4 program (Huson and Bryant 2006) carries out the relevant calculations under algorithms entitled Reticulation Network, Recombination Network or Hybridization Network, although these all produce the same outcome once the set of splits has been determined. These options are no longer available from the menu system (in the current release of the program), but they can still be effected via the Configure Pipeline menu option.

The point of this post is to point out that the calculations are affected by the same limitation that has been pointed out before under other circumstances (see the post A fundamental limitation of hybridization networks?). That is, reticulation cycles with three or fewer outgoing arcs are not uniquely defined with respect to rooted splits — there are three equally optimal mathematical solutions. In practice, this means that in a situation where two taxa are involved in producing a third taxon we cannot decide from the splits alone which is the reticulate taxon and which are the two "parents" (eg. which one is the hybrid).

An example

I will illustrate this point with a simple example. The data are taken from Wendel et al. (1991). The data consist of the presence-absence of 76 nuclear allozyme loci and 13 nuclear restriction sites, for five plant taxa, one of which is the outgroup. The first graph shows the splits graph using the default options in SplitsTree4 — both the NeighborNet and the ParsimonySplits analyses produce the same graph, which identifies a single reticulation.


In SplitsTree4, the outgroup for rooting the splits graph must be the first taxon in the datafile, which in this case is Gossypium robinsonii. The following three graphs are the result of then choosing the ReticulateNetwork analysis. They differ by having, respectively, Gossypium bickii as the final taxon in the dataset, Gossypium sturtianum as the final taxon, and Gossypium australe + Gossypium nelsonii as the final two taxa. Note that the ReticulateNetwork algorithm always identifies the dataset's final taxon as the reticulate one.


So, the hybrid taxon is indeterminable from the data given, and the algorithm simply makes a (consistent) choice from among the three possibilities. [That is, the algorithm chooses as the reticulate arc whichever of the three outgoing arcs is latest in the dataset.]

The original authors suggest that the nuclear and other data "indicate a biphyletic ancestry of G. bickii. Our preferred hypothesis involves an ancient hybridization, in which G. sturtianum, or a similar species, served as the maternal parent with a paternal donor from the lineage leading to G. australe and G. nelsoni." This doesn't quite match any of the three rooted networks shown above.

References

Huson DH, Bryant D (2006) Application of phylogenetic networks in evolutionary studies. Molecular Biology and Evolution 23: 254-267.

Huson DH, Kloepper TH (2005) Computing recombination networks from binary sequences. Bioinformatics 21: ii159-ii165.

Huson DH, Klöpper TH (2007) Beyond galled trees – decomposition and computation of galled networks. Lecture Notes in Bioinformatics 4453: 211-225.

Huson DH, Klöpper T, Lockhart PJ, Steel MA (2005) Reconstruction of reticulate networks from gene trees. Lecture Notes in Bioinformatics 3500: 233-249.

Wendel JF, Stewart JM, Rettig JH (1991) Molecular evidence for homoploid reticulate evolution among Australian species of Gossypium. Evolution 45: 694-711.

Wednesday, January 28, 2015

Networks to detect ancient recombinations


We don't normally discuss individual papers in this blog (except as example datasets), but today I am simply drawing your attention to what appears to be a little-known paper on phylogenetic networks.

Naruya Saitou has not contributed much to the theory of networks, being instead best known for the development of the neighbor-joining method for phylogenetic trees. (The 20th most cited paper ever; see Massive citations of bioinformatics in biology papers) However, this recent paper is of interest:
Naruya Saitou, Takashi Kitano (2013) The PNarec method for detection of ancient recombinations through phylogenetic network analysis. Molecular Phylogenetics and Evolution 66: 507-514.
The paper presents a new method for detecting ancient recombinations through phylogenetic network analysis. Recent recombinations are easily detectable using alternative methods, although splits graphs can also be used, but older recombinations are more tricky.

Importantly, I particularly like the opening paragraph of the paper:
The good old days of constructing phylogenetic trees from relatively short sequences are over. Reticulated or "non-tree" structures are omnipresent in genome sequences, and the construction of phylogenetic networks is now the default for describing these complex realities. Recombinations, gene conversions, and gene fusions are biological mechanisms to produce non-tree structures to gene phylogenies, while gene flow is a well known factor for creating reticulations within population phylogenies.
These are heart-warming words from the developer of the most commonly used tree-building method!

Wednesday, December 17, 2014

Current methods for evolutionary networks


It has been noted before that we have a wide range of mathematical techniques available for producing data-display networks, most notably the many variants of splits graphs (see Huson & Scornavacca 2011). For example, NeighborNets and Consensus networks are commonly encountered in the phylogenetics literature, and Reduced median networks and Median-joining networks are commonly used for haplotype networks in population biology.

However, there are few techniques used to produce evolutionary networks. Studies of reticulate evolutionary histories, which include recombination networks, hybridization networks, introgression networks and HGT networks, have no unifying theme as yet. So, the biological literature has many papers in which biologists struggle with reticulate evolutionary histories using ad hoc collections of techniques, which often boil down to simply presenting incongruent phylogenetic trees from different datasets (see Morrison 2014a).

So, maybe a brief look at the current state of play with evolutionary networks would be useful. There are enough worthwhile techniques out there for people to be using them more often than they are.

Assumptions

Almost all current phylogenetic methods assume that the basic building unit is a non-recombining sequence block, for which the evolutionary history is strictly tree-like. We tend to call these blocks "genes" and their history "gene trees", but this is just for semantic convenience. In practice, we first collect data for various loci, and we then simply make the assumption that there is recombination between the loci but not within them. This is basically the assumption of independence between loci. At the limit, each nucleotide along a chromosome has a tree-like history, but for aggregations of nucleotides it is all assumptions.

Furthermore, we assume that there are no data errors that will confound any reconstruction of the phylogenetic trees. Possible sources of error include: incorrect data (e.g. contamination), inappropriate sampling (taxa or characters), and model mis-specification. Any of these errors will lead to stochastic variation at best and to bias at worst.

Gene-tree incongruence

Reticulate evolutionary processes lead to gene trees that are not all congruent. However, there are two other processes that have been widely recognized as also producing gene-tree incongruence, but which do not involve reticulation in the strict sense: incomplete lineage sorting (deep coalescence; ancestral polymorphism), and gene duplication-loss.

Many studies have now shown that stochastic variation due to ILS can be very large (see Degnan & Rosenberg 2009), and that this varies in relation to both the population sizes of the taxa and the times between divergence events. The expectation of completely congruent gene trees is thus very naive, even when the evolutionary history of the taxa has been strictly tree-like. A number of methods have been developed to reconstruct species trees in the face of ILS (Nakhleh 2013).

DL involves gene duplication (which can be repeated to create gene families) followed by selective gene loss. The phylogenetic history of the genes is usually presented as an unfolded species tree, where each gene copy has its own part of the tree. A number of methods have been developed to reconstruct gene DL histories given a "known" species tree, which is called gene-tree reconciliation (Szöllősi et al 2015). However, our interest here is in the reverse process, in which reconstructed but incongruent gene trees are combined into a single species tree, given a model of duplication and selective loss, which is called species-tree inference (which is the same as cophylogeny reconstruction; Drinkwater & Charleston 2014).

Reticulations

Known biological processes such as recombination, reassortment, hybridization, introgression and horizontal gene transfer all create reticulate phylogenetic histories. However, it is a moot point as to whether these processes can be distinguished from each other solely in the context of an evolutionary network (Holder et al 2001; Morrison 2015). These evolutionary processes operate by distinct biological mechanisms, but the evolutionary patterns that they create can all be rather similar. The processes all result in gene flow among contemporaneous organisms (usually called horizontal flow or transfer), whereas other evolutionary processes involve gene flow from parent to offspring (usually called vertical inheritance), including ILS and DL. These gene flows create incongruent gene histories, which we may detect directly in the data or via reconstructed gene trees. The patterns of incongruence do not necessarily allow us to infer the causal process.

There are a number of differences in pattern, but the consistency of these is doubtful. Polyploid hybridization produces the most distinctive pattern, because there is duplication of the genome in the hybrid. However, subsequent aneuploidy will serve to obscure this pattern. Homoploid hybridization nominally involves 50% of the genome coming from difference sources, while introgression ultimately involves a smaller percentage. However, in practice, genome mixtures vary continuously from 0 to 50%. HGT also involves a small percentage of the genome, but in theory it also can vary from 0 to 50%. Reassortment produces mixtures of viral genes, which can occur in such a great number that reconstructing the history is severely problematic.

So, in the absence of independent experimental evidence, distinguishing one form of evolutionary network from another is almost a matter of definition. This has become increasingly obvious in the methodological literature, where semantic confusion abounds.

For example, a network produced directly from a set of characters has usually been called a "recombination network", while one produced from a set of trees has usually been called a "hybridization network", irrespective of what processes the gene trees represent. Furthermore, models that add reticulation events to DL trees have usually referred to the horizontal gene flow as "HGT", whereas models that add reticulation events to ILS trees have usually referred to the horizontal gene flow as "hybridization" (Morrison 2014a). Studies of horizontal gene flow during human evolution have usually referred to "admixture", which is a more process-neutral term.

In many, if not most, cases we might all be better off if network methods simply distinguish gene flow among contemporaries (horizontal) from gene inheritance between generations (vertical), rather than trying to infer a process — process inference can often best take place after network construction. This does not help anthropologists, of course, who are dealing with evolutionary networks where oblique gene flow is possible (so that they do not have Time inconsistency in evolutionary networks).

Methods

There seems to be a dichotomy of purposes to current method development, which are neatly summarized by the contrasting theoretical views of Mindell (2013) and Morrison (2014b). These views each recognize that evolutionary history involves both vertical and horizontal processes, but they reconstruct the resulting evolutionary patterns as a species tree and a species network, respectively. Obviously, this blog is dedicated to the latter point of view, but it is the former one (the so-called Tree of Life) that seems to currently dominate the literature.

Focussing on gene-tree inference, Szöllősi et al (2015) provide a comprehensive review of the various models that have been used to describe the dependence between gene trees and species trees. Essentially, gene trees are contained within the species tree, and they may differ from it in relative branch lengths and/or topology. The differences between genes and species are the result of population-level processes, often modeled using the coalescent. These authors recognize four current classes of probabilistic model that combine different evolutionary processes:
  • the DLCoal model, which combines coalescence and DL
  • the DTLSR model and the ODT model, both of which combine gene transfer and DL
  • models that combine hybridization and ILS
  • models of allopolyploidization.
When inferring species trees from gene trees (species-tree inference), we basically combine the scores for all of the gene trees, and then search for the species tree with the best overall score. This involves adding the scores in parsimony analyses, or multiplying the conditional probabilities in likelihood analyses (ie. maximum-likelihood or bayesian context). Many methods have been developed for inferring a species tree based on multi-locus data. These differ in whether the gene and species trees are estimated simultaneously or sequentially, and in how the gene trees are used to infer the species tree. Nakhleh (2013) and Szöllősi et al (2015) discuss both parsimony and likelihood methods for species-tree inference based on either ILS or DL models.

Extending these ideas to infer networks (rather than species trees) is a bit more tricky, and most of the work to date has involved combining hybridization and ILS. There has been no recent summary of the ideas. However, calculating the parsimony score of a network, given a set of gene-tree topologies, has been addressed by Yu et al (2011); and Yu et al (2013a) have extended these ideas to heuristically search the network space for the optimal network (the one that minimizes the number of extra reticulation lineages in a species tree). Furthermore, methods for computing the likelihood of a phylogenetic network, given a set of gene-tree topologies, have been devised by Yu et al (2012, 2013b); and Yu et al (2014) have extended these ideas to heuristically search for the maximum-likelihood network for limited cases of introgression or hybridization (since they differ only in degree).

There are also several methods that simply use gene-tree incongruence to infer reticulation events in a species network (Huson et al 2010). Basically, these methods combine gene trees into "hybridization networks" by minimizing the number of reticulations required for reconciliation, measured either by counting the reticulations or calculating the network level. The combinatorial optimization can be based on trees, triplets or clusters, using parsimony as the optimality criterion. These methods model homoploid hybridization by assuming that reticulation is the sole cause of all gene-tree incongruence. This means that they are likely to overestimate the amount of reticulation in a dataset when other processes are co-occurring.

The most completely developed network methods involve data for allopolyploid hybrids. Here, there are multiple copies of each gene, one in each copy of the genome, so that allopolyploid hybrids have more copies than do their diploid parent taxa. To construct a hybridization network topology, Huber et al (2006) developed a parsimony method based on first estimating a multi-labeled gene tree, and then searching for the single-labeled network that best accommodates the multiple gene patterns. The model has been extended to heuristically include ILS (Marcussen et al 2012), as well as dates for the internal nodes (Marcussen et al 2015). Jones et al (2013) have also developed models that incorporate ILS in a bayesian context, but only for the case of a single hybridization event between two diploid species (an allotetraploid).

Species-tree inference for a pair of gene phylogenies that may be networks not trees, has been considered in terms of parsimony by Drinkwater & Charleston (2014).

This brings us to the matter of introgression. The massive recent influx of genome-scale data for hominids has lead to the development of methods explicitly for the analysis of what is termed admixture among the lineages. These methods basically work by constructing a phylogenetic tree that includes admixture events, the topology inference being based on allele frequencies. There has been no formal comparison of the methods, and not much application to non-humans. Three such methods have been produced so far (Patterson et al 2012; Pickrell & Pritchard 2012; Lipson et al 2013).

Recombination has somewhat been the poor cousin to other causes of reticulation, as most network methods assume it to be absent. Nevertheless, Gusfield (2014) has recently provided an ample survey of the study methods available to date.

References

Degnan JH, Rosenberg NA (2009) Gene tree discordance, phylogenetic inference and the multispecies coalescent. Trends in Ecology & Evolution 24: 332-340.

Drinkwater B, Charleston MA (2014) An improved node mapping algorithm for the cophylogeny reconstruction problem. Coevolution 2: 1-17.

Gusfield D (2014) ReCombinatorics: the Algorithmics of Ancestral Recombination Graphs and Explicit Phylogenetic Networks. MIT Press, Cambridge.

Holder MT, Anderson JA, Holloway AK (2001) Difficulties in detecting hybridization. Systematic Biology 50: 978-982.

Huber KT, Oxelman B, Lott M, Moulton V (2006) Reconstructing the evolutionary history of polyploids from multilabeled trees. Molecular Biology & Evolution 23: 1784-1791.

Huson D, Rupp R, Scornavacca C (2010) Phylogenetic Networks: Concepts, Algorithms, and Applications. Cambridge University Press, Cambridge.

Huson DH, Scornavacca C (2011) A survey of combinatorial methods for phylogenetic networks. Genome Biology & Evolution 3: 23-35.

Jones G, Sagitov S, Oxelman B (2013) Statistical inference of allopolyploid species networks in the presence of incomplete lineage sorting. Systematic Biology 62: 467-478.

Lipson M, Loh P-R, Levin A, Reich D, Patterson N, Berger B (2013) Efficient moment-based inference of population admixture parameters and sources of gene flow. Molecular Biology & Evolution 30: 1788-1802.

Marcussen T, Heier L, Brysting AK, Oxelman B, Jakobsen KS (2015) From gene trees to a dated allopolyploid network: insights from the angiosperm genus Viola (Violaceae). Systematic Biology 64: 84-101.

Marcussen T, Jakobsen KS, Danihelka J, Ballard HE, Blaxland K, Brysting AK, Oxelman B (2012) Inferring species networks from gene trees in high-polyploid north American and Hawaiian violets (Viola, Violaceae). Systematic Biology 61: 107-126.

Mindell DP (2013) The Tree of Life: metaphor, model, and heuristic device. Systematic Biology 62: 479-489.

Morrison DA (2014a) Phylogenetic networks: a review of methods to display evolutionary history. Annual Research and Review in Biology 4: 1518-1543.

Morrison DA (2014b) Is the Tree of Life the best metaphor, model or heuristic for phylogenetics? Systematic Biology 63: 628-638.

Morrison DA (2015, in press) Pattern recognition in phylogenetics: trees and networks. In: Elloumi M, Iliopoulos CS, Wang JTL, Zomaya AY (eds) Pattern Recognition in Computational Molecular Biology: Techniques and Approaches. Wiley, New York.

Nakhleh L (2013) Computational approaches to species phylogeny inference and gene tree reconciliation. Trends in Ecology & Evolution 28: 719-728.

Patterson NJ, Moorjani P, Luo Y, Mallick S, Rohland N, Zhan Y, Genschoreck T, Webster T, Reich D (2012) Ancient admixture in human history. Genetics 192: 1065-1093.

Pickrell JK, Pritchard JK (2012) Inference of population splits and mixtures from genome-wide allele frequency data. PLoS Genetics 8: e1002967.

Szöllősi GJ, Tannier E, Daubin V, Boussau B (2015) The inference of gene trees with species trees. Systematic Biology 64: e42-e62.

Yu Y, Barnett RM, Nakhleh L (2013a) Parsimonious inference of hybridization in the presence of incomplete lineage sorting. Systematic Biology 62: 738-751.

Yu Y, Degnan JH, Nakhleh L (2012) The probability of a gene tree topology within a phylogenetic network with applications to hybridization detection. PLoS Genetics 8: e1002660.

Yu Y, Dong J, Liu KJ, Nakhleh L (2014) Maximum likelihood inference of reticulate evolutionary histories. Proceedings of the National Academy of Sciences of the USA 111: 16448-16453.

Yu Y, Ristic N, Nakhleh L (2013b) Fast algorithms and heuristics for phylogenomics under ILS and hybridization. BMC Bioinformatics 14: S6.

Yu Y, Than C, Degnan JH, Nakhleh L (2011) Coalescent histories on phylogenetic networks and detection of hybridization despite incomplete lineage sorting. Systematic Biology 60: 138-149.

Wednesday, July 30, 2014

ReCombinatorics


This post is just to let everyone know that Dan Gusfield's long-awaited book on the interface between phylogenetics and population genetics is now available.


The book is targeted for mathematically inclined readers. It has a few contributions from Charles H. Langley, Yun S. Song and Yufeng Wu. The title is described as "a portmanteau word derived from the single-crossover recombination of the words 'recombination' and 'combinatorics'."

Hardcover 448 pp; ISBN: 9780262027526; $60.00 £30.95
More information is available from The MIT Press.

This new book joins these previous contributions to the genre:

Image from Celine Scornavacca.

Wednesday, October 16, 2013

What are evolutionary networks currently used for?


These days, there are many unrooted affinity-type networks used to display conflicting phylogenetic signals. There are many different methods available, although the various forms of splits graphs seem to dominate, especially NeighborNet and Consensus Networks (for species-level data), and Reduced Median Networks and Median Joining Networks (for population-level data). However, phylogeneticists are interested in genealogies, not just data displays.

Unfortunately, rooted evolutionary networks are not so well off. There is a great need for such networks in phylogenetics, but there are very few automated methods available for constructing them. These networks are needed whenever a genealogy involves reticulation processes rather than solely divergence. The latter produces a tree-like evolutionary history but the former do not, and these thus require network methods.

Due to the lack of obvious methods, most current research papers still do not illustrate reticulate evolution with a genealogy. A collection of ad hoc methods is usually applied to the data, and the evolutionary processes are then inferred from this. However, the use of a network to illustrate the inferred genealogy is rather rare.

Indeed, for species-level studies most papers simply present a set of incongruent gene trees, although some of them also illustrate either (i) the tree derived from the combined data, or (ii) a consensus tree with or without the conflicting relationships, or (iii) a pair of cophylogeny trees. Occasionally, the hybrid origin of some of the species, for example, is illustrated, but the putative parents are not connected in a phylogeny.

Population-level studies often present unrooted haplotype networks, illustrating processes such as hybridization and introgression between closely related species, or the evolution of domesticated species.

However, these ad hoc methods do not mean that evolutionary networks do not appear in the literature. In this blog post I include a representative sample of rooted networks that are intended to illustrate inferred genealogies. They are grouped according to the evolutionary processes being studied (see Reticulation patterns and processes in phylogenetic networks). I have also briefly indicated how the networks were constructed.

Homoploid Hybridization

Hybridization is commonly studied in the literature, and phylogenetic networks appear not infrequently. This first example was constructed by the unreleased program HyperPars.

Dickerman AW (1998) Generalizing phylogenetic parsimony from the tree to the forest. Systematic Biology 47: 414-426.


This next example was constructed by program SplitsTree. Note that the root of the network is not clearly indicated.

Pirie MD, Humphreys AM, Barker NP, Linder HP (2009) Reticulation, data combination, and inferring evolutionary history: an example from Danthonioideae (Poaceae). Systematic Biology 58: 612-628.


This example was constructed manually from a set of gene trees. Note that it is drawn in a rather unusual style for indicating hybridization.

Sang T, Crawford D, Stuessy T (1997) Chloroplast DNA phylogeny, reticulate evolution, and biogeography of Paeonia (Paeoniaceae). American Journal of Botany 84: 1120-1136.


Polyploid Hybridization

Polyploid hybridization is probably the most likely type of study to have a phylogenetic network. This is at least partly because there is a computer program, Padre, to automate much of the work. This program was used to construct this first network.

Marcussen T, Jakobsen KS, Danihelka J, Ballard HE, Blaxland K, Brysting AK, Oxelman B (2012) Inferring species networks from gene trees in high-polyploid North American and Hawaiian violets (Viola, Violaceae). Systematic Biology 61: 107-126.


This next example was also constructed by program Padre.

Sessa EB, Zimmer EA, Givnish TJ (2012) Unraveling reticulate evolution in North American Dryopteris (Dryopteridaceae). BMC Evolutionary Biology 12: 104.


This example constructed manually from a gene tree.

Marhold K, Lihová J (2006) Polyploidy, hybridization and reticulate evolution: lessons from the Brassicaceae. Plant Systematics and Evolution 259: 143-174.


Introgressive Hybridization

Introgression is a widely studied phenomenon. However, rooted evolutionary networks are rarely presented. This first one was constructed manually from a set of gene trees.

Koblmüller S, Duftner N, Sefc KM, Aibara M, Stipacek M, Blanc M, Egger B, Sturmbauer C (2007) Reticulate phylogeny of gastropod-shell-breeding cichlids from Lake Tanganyika — the result of repeated introgressive hybridization. BMC Evolutionary Biology 7: 7.


The next example was also constructed manually from a set of gene trees.

Morgan DR (2003) nrDNA external transcribed spacer (ETS) sequence data, reticulate evolution, and the systematics of Machaeranthera (Asteraceae). Systematic Botany 28: 179-190.


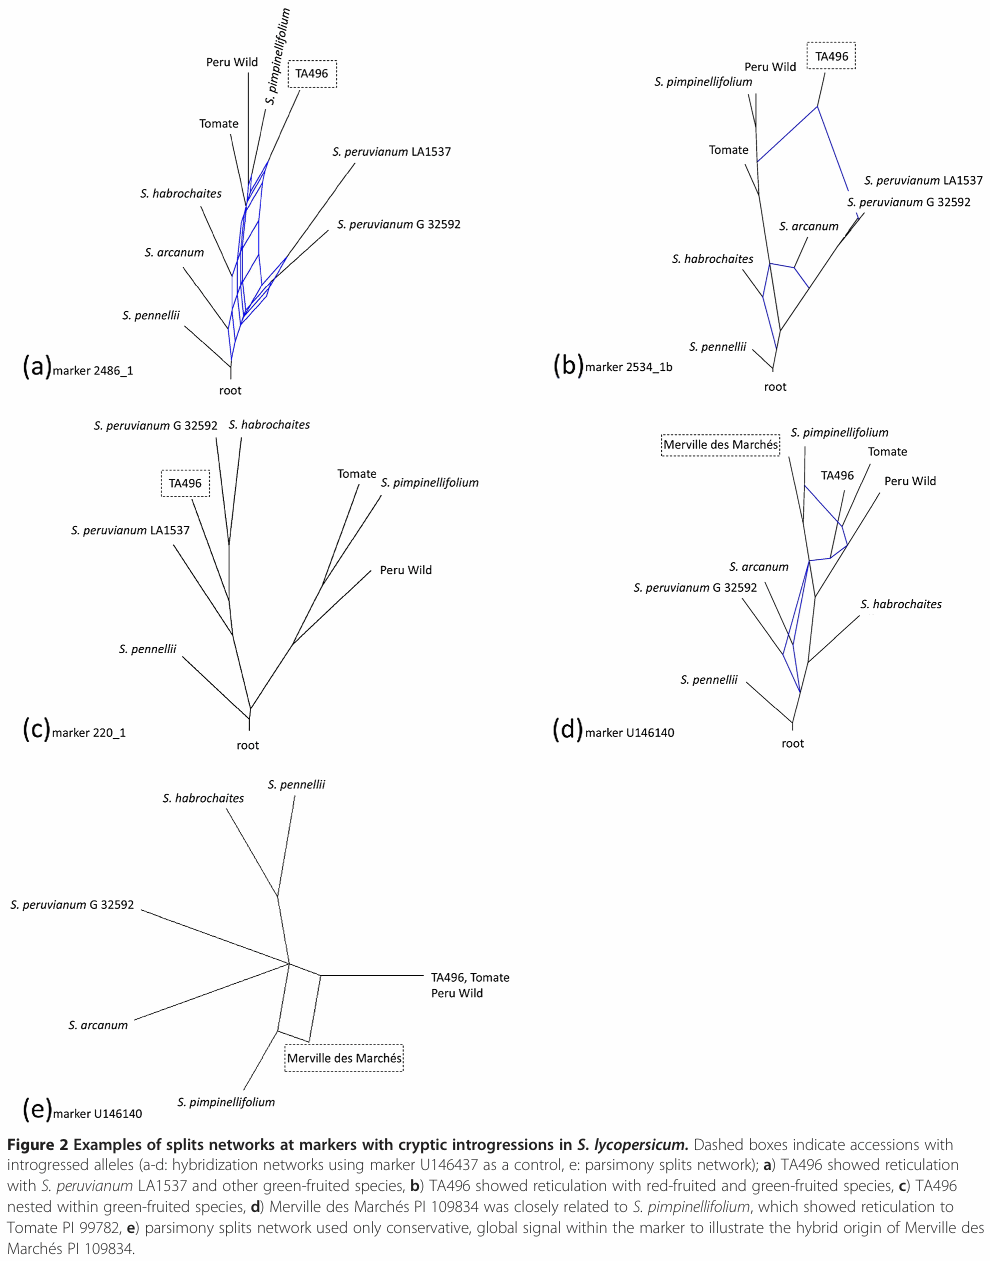
This example was constructed by program SplitsTree.

Labate JA, Robertson LD (2012) Evidence of cryptic introgression in tomato (Solanum lycopersicum L.) based on wild tomato species alleles. BMC Plant Biology 12: 133.


Horizontal Gene Transfer

HGT is a hot topic these days, both among prokaryotes and among eukaryotes, although most papers do not present a phylogenetic network. The first example was constructed by program Sprit from the species tree and a gene tree.

Walsh AM, Kortschak RD, Gardner MG, Bertozzi T, Adelson DL (2013) Widespread horizontal transfer of retrotransposons. Proceedings of the National Academy of Sciences USA 110: 1012-1016.


This next example was constructed manually from a gene tree.

Delwiche CF, Palmer JD (1996) Rampant horizontal transfer and duplication of rubisco genes in eubacteria and plastids. Molecular Biology and Evolution 13: 873-882.


This example was constructed manually from incongruence among a series of gene trees.

Richards TA, Soanes DM, Foster PG, Leonard G, Thornton CR, Talbot NJ (2009) Phylogenomic analysis demonstrates a pattern of rare and ancient horizontal gene transfer between plants and fungi. The Plant Cell 21: 1897-1911.


Homologous Recombination

Intra-genic recombination is often studied without reference to a network. Nevertheless, several programs exist, and this particular network was constructed by program Kwarg.

Jenkins PA, Song YS, Brem RB (2012) Genealogy-based methods for inference of historical recombination and gene flow and their application in Saccharomyces cerevisiae. PLoS One 7: e46947.


Chromosomal rearrangements are studied rather rarely. This network was constructed manually from a phylogenetic tree. Note that the root of the network is not clearly indicated.

Rumpler Y, Hauwy M, Fausser JL, Roos C, Zaramody A, Andriaholinirina N, Zinner D (2011) Comparing chromosomal and mitochondrial phylogenies of the Indriidae (Primates, Lemuriformes). Chromosome Research 19: 209-224.


Viral Reassortment

Reassortment of segmented viruses produces very complex networks. This one is a partial network, constructed manually from a series of phylogenetic analyses.

Smith GJ, Vijaykrishna D, Bahl J, Lycett SJ, Worobey M, Pybus OG, Ma SK, Cheung CL, Raghwani J, Bhatt S, Peiris JS, Guan Y, Rambaut A (2009) Origins and evolutionary genomics of the 2009 swine-origin H1N1 influenza A epidemic. Nature 459(7250): 1122-1125.


Genome Fusion

This is a difficult topic to study. As is almost always done, this network was constructed manually from a phylogenetic tree.

Thiergart T, Landan G, Schenk M, Dagan T, Martin WF (2012) An evolutionary network of genes present in the eukaryote common ancestor polls genomes on eukaryotic and mitochondrial origin. Genome Biology and Evolution 4: 466-485.


Apomixis

This topic rarely involves networks. This network was constructed manually from the output of program SplitsTree.

Dyer RJ, Savolainen V, Schneider H (2012) Apomixis and reticulate evolution in the Asplenium monanthes fern complex. Annals of Botany 110: 1515-1529.


Removing Convergence

This is an unusual use of a network, but the author notes that "the use of reticulations clarifies the phylogeny by factoring out apparent convergence, even though there is no reason to think that actual hybridization or introgression has occurred." The network was constructed by an unreleased program.

Alroy J (1995) Continuous track analysis: a new phylogenetic and biogeographic method. Systematic Biology 44: 152-178.


Wednesday, October 2, 2013

Reticulation patterns and processes in phylogenetic networks


When it comes to phylogenetic networks, there is often misunderstanding between biological and computational scientists, because the former tend to focus on the biological processes underlying the network whereas the latter focus on the patterns needing to be analyzed to produce the networks.

Here, I try to provide a summary of the different processes and patterns involved in reticulation, so that both "sides" get an overview, and hopefully can communicate more easily. I am principally discussing the development of networks that display evolutionary history.

In phylogenetics, historical processes create contemporary patterns, and we then try to detect those patterns, and assess them in order to determine what process created each pattern. Computationally, algorithms will detect certain data patterns and display them in a directed acyclic graph, which is then interpreted biologically. What needs to happen is for us to identify the possible patterns created by the different processes, so that algorithms can be developed that will detect them. It is doubtful that an algorithm will be able to identify all individual processes — it will be up to biologists to work out what process created each pattern detected.

In what follows, there are major simplifications from both the biological and computational points of view, so please be aware of that. In particular, note that I have not discussed either deep coalescence or gene duplication-loss which, if present, will confound the detection of reticulation patterns.

Hybridization (hybrid speciation)

This is the formation of a new species via sexual reproduction. There are two basic forms that are of interest:
Homoploid Hybridization, in which one copy of the genome is inherited from each parent species (eg. diploid parents create a diploid hybrid);
Polyploid Hybridization, in which multiple copies of the genome are inherited from each parent species (eg. diploid parents create a polyploid hybrid).


Polyploid hybridization is usually assessed by sequencing each copy of the genome in the hybrid species, and treating each copy as a terminal in the data analysis, This produces a multi-labelled genome tree, which is then turned into a single-labelled species network.

At the species level, homoploid hybridization is usually assessed by sequencing several genes in the hybrid species (often from both the nuclear and non-nuclear genomes) and producing independent gene trees. The species network is created by resolving conflicts among the gene trees. This form of analysis assumes a data pattern that is very similar to that of HGT.

In population studies, homoploid hybridization is usually assessed at the sequence level, using multiple-copy nuclear genes, where hybrids are detected by additive polymorphisms at some alignment positions.

Introgression (introgressive hybridization)

This is the transfer of genetic material from one species to another via sexual reproduction. This happens when hybrid individuals back-cross preferentially to one of the parental species, rather than forming a new hybrid species. It can involve anything from 1-49% of the genome (at 50% it is best called hybridization). The data pattern created is very similar to that of HGT (the transfer of genetic material from one species to another via non-sexual means).


It is usually assessed at the population level, by sequencing one or more genes (often from both the nuclear and non-nuclear genomes) from many individuals, and demonstrating that identical haplotypes (haploid genotypes) occur in what are recognized as separate species. This is done by constructing a haplotype network. Often, individuals are detected where the non-nuclear haplotype differs from the nuclear haplotype (as shown in the figure).

Horizontal Gene Transfer

This is the transfer of genetic material from one species to another via non-sexual means (eg. transformation, transduction, or conjugation). The data pattern created is very similar to that of introgression (the transfer of genetic material from one species to another via sexual reproduction).

It is sometimes assessed by sequencing several genes and producing independent gene trees. The species network is created by resolving conflicts among the gene trees. This form of analysis assumes data that are very similar to those of homoploid hybridization or recombination.

Alternatively, it is often assessed by comparing gene trees to a species tree (either pre-specified, or derived from multi-gene data). The species network is created by resolving conflicts between the gene trees and the species tree.

Homologous Recombination and Viral Reassortment

These involve homologous parts of a genome breaking part and re-arranging themselves, often during sexual reproduction. With cross-over the two genomes exchange material, and with gene conversion one genome acquires material from the other. There are three basic forms that are of interest:
Intra-genic Recombination, in which the break-points occur within a single gene;
Inter-genic Recombination, in which the break-points occur in different genes or non-coding spaces between genes;
Reassortment, in which segmented viruses re-combine their segments to create new strains (similar to gene conversion); this is basically inter-genic recombination without sex.


Intra-genic recombination is usually analyzed at the sequence level, based on ordered data. The gene network is constructed by identifying break-points, and thus the recombined segments. It is also possible for one of the donors of a recombined sequence to be missing from the dataset, in which case the data pattern will be the same as for HGT without the donor sampled.

Inter-genic recombination will produce the same pattern as hybridization, if both break-points are outside the region sequenced. Furthermore, homoploid hybridization can be thought of as recombination of whole chromosomes.

Viral reassortment is usually assessed by comparing strains with each other based on presence-absence of segmental haplotypes (rather similar to haplotyping of sexual organisms). This is a unique form of analysis, and it can produce incredibly complex networks.

Summary

Process

Polyploid hybridization (species)
Homoploid hybridization (species)
Homoploid hybridization (population)

Introgression (population)

Horizontal gene transfer (species)


Intra-genic recombination
Inter-genic recombination
Reassortment (population)
Evaluation method

multi-labelled tree
incongruent gene trees
sequence additive polymorphisms

haplotype network

incongruent gene trees
incongruent gene/species trees

sequence break-points
incongruent gene trees
haplotype network

It may be impossible ever to reliably distinguish homoploid hybridization, introgression, HGT and inter-genic recombination from each other by pattern analysis alone, at least not without genome-scale data.

Wednesday, January 30, 2013

More datasets for validating network algorithms


Ten more datasets have been added to the Datasets blog page. These are:
  • 2 plant studies where hybrids are known from experimentation
  • 3 more plant studies where natural hybrids are known
  • 5 studies (fungi, plants, protozoa, viruses, animals) where recombination is known.

A comment

It is worth noting something that has become obvious to me while compiling these datasets — the mathematical model often applied to hybridization networks cannot easily be applied to many of the datasets collected by biologists. The usual mathematical model involves incompatibility between two or more trees for the same set of taxa, for example from different genes or genomes. The incompatibilities are resolved by postulating one or more reticulations in the network.

However, the data produced by biologists often involve only a single nuclear gene, most frequently the Internal Transcribed Spacer region, so that the biologists do not have multiple trees. Instead, hybrids are detected by additive polymorphisms at alignment positions within the study gene. These polymorphisms arise either from (i) the polyploid nature of the hybrids (there are multiple copies of each chromosome, each of which may have a gene copy from either parental species), or (ii) from multiple paralogous copies of the genes (the rRNA region, which contains the ITS, usually has many tandemly repeated copies of the genes, which are homogenized by concerted evolution, but in a hybrid any of them may have a gene copy from either parental species).

This means that it is difficult to use any current evolutionary network for the phylogenetic analysis of many of the datasets used for detecting hybridization. In turn, this suggests that we may need a different model, one based on additive polymorphisms rather than incongruent trees.

The usual mathematical model for lateral-transfer networks is actually the same as for hybridization networks, since the only real difference between HGT and hybridization is that HGT does not occur via sexual reproduction while hybridization does. (Also, hybridization often involves whole genomes while HGT usually involves partial genomes.) Importantly, the mathematical model does seem to apply to the sort of datasets collected by biologists when they are studying HGT. That is, HGT is detected by incompatibility between two or more trees for the same set of taxa. Indeed, this model is usually the only evidence for HGT, unlike hybridization and recombination where there is often evidence that is independent of the network model.

Wednesday, January 16, 2013

Datasets for validating algorithms for evolutionary networks


Steven Kelk has previously raised the issue about Validating methods for constructing evolutionary phylogenetic networks: there are currently not many options for validating the biological relevance of methods for constructing evolutionary phylogenetic networks. These are phylogenetic networks intended to represent evolutionary history, such as HGT networks. hybridization networks, and recombination networks.

Thus, we need a repository of biological datasets where there is some level of consensus amongst biologists as to the character, extent and location of reticulate evolutionary events. This could then be used as a framework for validating the output of algorithms for constructing evolutionary phylogenetic networks.

This issue was discussed at some length at the Workshop: The Future of Phylogenetic Networks. It was suggested by Leo van Iersel that a practical starting point would be to use this blog as a link to suitable datasets. As people become aware of such datasets, a blog post would be published with the details, and the dataset would be linked from one of the blog Pages.

This page now exists (Datasets), and can be accessed at the top right of each blog page. Everyone is encouraged to contribute to this "database", which you can do by sending details about potential dataset  to me by email.

In another post, What should a database of datasets look like?, I have noted that there have been four suggested approaches to acquiring datasets for evaluating algorithms (in order of increasing reality):
  1. simulate datasets under one or more data-generation models
  2. create mixed datasets from "pure" datasets, or create artificial mosaic taxa from real datasets
  3. use datasets where the postulated reticulation events have been independently confirmed
  4. experimentally create taxa with a known evolutionary history.
It seems unnecessary to store datasets of type (1), since they can be created to order by computer programs. Datasets of type (2) are rare, but would be suitable for the database.

Datasets of type (4) currently exist for tree-like evolutionary histories but not yet, as far as I know, for reticulated histories. I have added the known (and available) ones to the database.

Datasets of type (3) are likely to form the bulk of the database, and I have started this part of the database with some example datasets involving hybridization.

For the latter datasets, it is important to note the potential problem of the degree to which the postulated reticulation events have been independently confirmed. I suspect that only weak evidence has been applied to far too many datasets. This is particularly true for those involving horizontal gene transfer (HGT), where mere incongruence between genes is presented as the sole "evidence". More than this is required (see Than C, Ruths D, Innan H, Nakhleh L. 2007. Confounding factors in HGT detection: statistical error, coalescent effects, and multiple solutions. Journal of Computational Biology 14: 517-535.).

Wednesday, November 7, 2012

Explanation of the many names for types of phylogenetic networks


Two types of phylogenetic network are commonly recognized, although there can be gradations between the two extremes. These go by many different names, which inevitably leads to some confusion on the part of users.

Some of the names are listed here, along with an explanation of what the terminology is intended to convey. The terms are arranged in pairs, indicating the two different types of network. The "network" part of the name is assumed in each case unless indicated otherwise.

      Type 1       Type 2
  1. Affinity  Genealogical
  2. Data-display Reticulogeny
  3. Implicit  Explicit
  4. Directed  Undirected
  5. Rooted  Unrooted
  6. Splits graph Augmented tree, Reconciliation, Recombination,
                  Hybridization
1.  This reflects the biologists' perspective, describing the different purposes for which networks have been used. Affinity networks display overall similarity relationships among the organisms, whereas genealogical networks display only historical relationships of ancestry.

2.  This reflects the assumptions used for the data analysis. Data-display networks are interpreted solely as visualizations of the patterns of variation in the data, while the reticulogenies are based on some inferences about those data patterns (such as their possible cause). Some network types, such as Reduced Median Networks and Median-Joining Networks, are based on algorithms that make partial inferences from the data. Data-display networks have mainly been used as affinity networks and reticulogenies as genealogical networks.

3.  This reflects the computational perspective, describing the goal of the algorithm used to analyze the data. Explicit networks are intended to provide a phylogeny in the traditional sense used for phylogenetic trees, displaying both vertical and horizontal patterns of descent with modification. Implicit networks provide information that can be used to explore phylogenetic patterns in a dataset without any direct interpretation as necessarily showing a phylogeny. Implicit networks have mainly been used as data-display networks and explicit networks as reticulogenies.

4.  This reflects the mathematical interpretation of networks as line graphs. In a directed graph the edges have a direction, usually indicated by an arrow, in which case the edges are more correctly referred to as arcs. Undirected graphs do not have directed edges.

5.  This reflects the tree-thinking view of phylogenetic networks, in which directed graphs are called rooted trees and undirected graphs are called unrooted trees. Rooted networks are usually treated as explicit networks and are thus used as genealogical networks, although there is no reason why they could not be used simply as a convenient form of data display.

6.  This reflects the modelling approach to network analysis based on mathematical structures. Splits graphs model phylogenetic patterns as bipartitions of the data, and build the network from those partitions (the result will be a tree if there are no incompatible bipartitions). Augmented trees are essentially trees with a few added reticulation edges / arcs, while reconciliation networks are based on reconciling the differences between trees. Recombination networks are based on analyzing data patterns in terms of a simple model of genetic cross-over, while hybridization networks model the data in terms of patterns in conflicting trees.

So, there are reasons why so many different terms have appeared in the literature. Unfortunately, they are not always used consistently with the meaning that was originally intended.

Monday, August 27, 2012

The all-dancing Primer of Phylogenetic Networks


In an earlier post I reported on the creation of an Online Primer of Phylogenetic Networks, which is intended as a simple introduction to networks for those people who already know something about phylogenetic trees. The primer can be read online, or downloaded as a PDF file (for printing) or as an ePub file (for reading on small screens).

Here, I note that the online version of the primer has now been updated with three animations (animated GIF files). These illustrate:
  1. the creation of a Median Network from character data;
  2. the creation of a Parsimony Tree from a Median Network, and
  3. the creation of a Recombination Network from a Median Network.
Any constructive feedback will be gratefully received.