Tuesday, March 27, 2012

An update on level-k phylogenetic networks


Picture of a galled tree, obtained from
http://carrot.mcb.uconn.edu/~olgazh/
Today we take a look at research aimed at constructing rooted level-k phylogenetic networks.

The notion of level was first introduced by Jesper Jansson and Wing-Kin Sung in 2006. They say that a binary rooted phylogenetic network has level-k if each biconnected component (tangled part) of the network contains at most k reticulations. They introduced these level-k networks as a generalization of galled trees, which were introduced by Dan Gusfield, Satish Eddhu and Charles Langley in 2003 as networks in which cycles do not overlap. The name ``galled trees'' was motivated by trees that have large swellings called galls, like the tree in the picture. Using the notion of level, galled trees are basically level-1 networks.

However, level-k networks can also just be seen as a generalization of networks with k reticulations.

It should be noted that there is a difference between searching for a network with minimum level and searching for a network with a minimum reticulation number. A network with minimum level might not have minimum reticulation number. Moreover, there might not be a minimum-level network that has minimum reticulation number (over all networks). This can be seen from a famous counter example by Gusfield, Bansal, Bafna and Song. A variant of this example appeared in the book by Huson, Rupp and Scornavacca. It gives a set of clusters and two networks that represent those clusters: a level-2 network with four reticulations and a level-3 network with three reticulations. The first network has minimum level, and minimum reticulation number over all minimum-level networks, but it does not have a minimum reticulation number over all networks. However, Gusfield et al. show that these counter examples are rare and Huson et al. argue that even in such cases the level-2 network is preferable over the level-3 network since in the latter network ``two completely unrelated parts of the phylogeny are linked together via reticulation edges''.

Constructing level-k phylogenetic networks has been studied for different inputs. An overview of results and a few open problems can be found at http://homepages.cwi.nl/~iersel/overview.html

That website shows a table with results for inputs consisting of trees, clusters and triplets. Triplets are rooted trees on three leaves each (the rooted variant of quartets). Triplets are sometimes also called three-taxon statements by biologists. Inputs consisting of triplets or clusters can for example be obtained from gene trees, or directly from DNA or character data.

An example of a real tree with a single cycle. This tree can
be seen as a network with one reticulation and thus as a
level-1 network.
For each input, four different problems are included in the table. For all problems the level k is fixed. The table shows which problems are in P (polynomial-time solvable) and which ones are NP-hard, and sometimes specifies some other results like approximation or FPT-algorithms. It can for example be seen that problems with a general set of triplets as input are mostly NP-hard. However, these problems are more tractable when the set of triplets is dense, i.e. if it contains a triplet for every combination of three taxa. For example, triplet sets obtained from binary trees are dense. Unfortunately, practical data is almost never binary and dense triplet sets are usually difficult to obtain.

In practice, of course, some of the input triplets/clusters/trees might be incorrect. Especially for triplets and clusters, it is therefore interesting to aim at finding a level-k network that is consistent with a maximum number of input triplets or clusters. This is the first row of the website table. Unfortunately, these problems are all extremely hard.

A more tractable problem is to search for a level-k network that is consistent with all elements of the input (trees, triplets or clusters), see the second row of the website table. For sets of clusters, there is an algorithm that is not only polynomial-time for fixed k, but even fixed-parameter tractable in k.

If it is possible to find a level-k network, it is also interesting to search for such a network that has a minimum number of reticulations (over all level-k networks). For dense triplet sets, we can do this in polynomial time, but whether such an algorithm is also possible for clusters is unclear. See the third row of the table.

Finally, a mathematically-interesting problem that is not directly applicable in practice is the question whether there exists a level-k network that is consistent with precisely those triplets/clusters/trees in the input. In other words, is there a level-k network N such that the set of triplets/clusters/trees represented by N is equal to the set of triplets/trees/clusters that are given in the input. There is not much known about this problem except that it is polynomial-time solvable for sets of triplets (see the last row of the table).

Any additions/corrections/comments on the table are welcome.

The picture of the galled tree (top right) was downloaded from: http://carrot.mcb.uconn.edu/~olgazh/ The second picture was taken in Queensland (Australia) by Leo van Iersel.

Sunday, March 25, 2012

Tattoo Monday III


This week we return to tattoos, with the most popular set of designs. These are designs for the traditionalist: Charles Darwin's best-known sketch from his Notebooks, showing his first attempt at a phylogenetic tree — with and without signature.


Further examples of this design are illustrated in Tattoo Monday V, Tattoo Monday VI and Tattoo Monday IX.

Thursday, March 22, 2012

Youngest contributor to phylogenetic networks


Today, I want to introduce you to the person who appears to be the youngest contemporary contributor to the mathematics of phylogenetic networks.

The relevant paper is:
Ethan Cecchetti (2007) Orientability of phylogenetic network graphs. Rose-Hulman Undergraduate Mathematics Journal 8(2): 3.

The particular journal concerned is "devoted entirely to papers written by undergraduates on topics related to mathematics". Ethan Cecchetti went one better than this: at the time of the work, he was a final-year secondary pupil at Lexington High School, in Massachusetts U.S.A. He first presented the work at the Massachusetts State Science and Engineering Fair in 2007.

At the moment this paper is listed in "Who is Who of Phylogenetic Networks" under the section "Articles or topics which may one day be in the database". However, there seems to be no reason not to include it. The standard of the mathematics seems to be good, discussing the requirements for an undirected graph to be turned into a directed acyclic graph.

The paper differs in only one obvious way from the standard stuff that we see in the current professional literature. A "network graph" is defined as having no directed circuits, and trivalent nodes with either indegree 1 and outdegree 2 or indegree 2 and outdegree 1. That is, there is no root node with indegree 0. All of the results follow from the lack of this unique root node.

Ethan has just recently graduated from Brown University, majoring in Mathematics and Computer Science. Some brief information is available on FaceBook, where his ultimate skill is also revealed. There is a less skillful (but more intriguing) appearance on YouTube, for those of you who would like to do a search.

This leads me to wonder who is the oldest contributor. That is, what is the paper that was published by the person who was the oldest at the time they produced the paper? And who was that person?

Sunday, March 18, 2012

Petri-dish Monday

This week we have some truly biological trees, in which the phylogeny is literally drawn by biological organisms growing in a petri dish.

The first example, a primate phylogeny, comes from the lab of T. Ryan Gregory. The image was created using live colonies of Escherichia coli bacteria. These images last only a few days, and a few others can be viewed on the lab's blog page.


The second example, showing the evolution of coral pigments, comes from the lab of Mikhail V. Matz. The image was created using colours from the great star coral, drawn on a petri dish with bacteria expressing the extant and reconstructed ancestral pigment proteins, under ultraviolet light. More information is available in the original publication.


Thursday, March 15, 2012

Online primer of phylogenetic networks


I have long felt the need for a simple introduction to networks for those people who know something about phylogenetic trees and would like to find out what this "network business" is all about.

So, I have attempted to create such a thing by writing an online primer.

It takes a toy dataset (real data for two genes from five species) and leads the reader step by step through the construction of various trees and networks, including a parsimony tree, a median network, a recombination network and a hybridization network. So, mathematically it tries to explain the relationship between these different ways of viewing the same dataset. Biologically, it considers the possible conflicts between characters within a gene as well as between genes, and what this might mean for phylogenetic analysis.

The primer can be read online, or downloaded as a PDF file (for printing) or an ePub file (for reading on small screens).

Any constructive feedback will be gratefully received.

Tuesday, March 13, 2012

Network measures and phylogenetic networks


Recently, I considered the relationships between phylogenetic networks and other types of biological network. I concluded that they may be quite different. This further suggests, that much of the theoretical work being directed towards the study of those networks ("network science"; eg. Newman 2010) may not turn out to be particularly relevant for phylogenetic networks, at least from the biological perspective. However, that does not mean that we should not look further into the idea.

One major aprt of the study of other biological networks has been the development of descriptive summaries of the network charactertistics. These characteristics are usually summarized by one or more mathematical measurements. This does not necessarily mean that biologists have seen any close relationship between these mathematical measures and biologically relevant quantities, but they are working on it.

So, it is worth considering whether any of these network measures have yet played a role in phylogenetic networks.

Network Measures

Properties of individual nodes

Node degree — number of incident edges to a node

  • for a dichotomous tree this is pre-defined (indegree 1, outdegree 2), and many network models have similar restrictions (eg. indegree 2, outdegree 1 for reticulation nodes)
  • however, applying the coalescent to a population network suggests that the node with the largest degree is the most probable common ancestor, so it is potentially of interest here

Degree distribution — frequency distribution of the degree for all nodes

  • not used so far, presumably because it would be uninteresting in light of the previous comment

Properties affected by local subgraphs of the network

Clustering coefficient — the degree to which nodes cluster together, measured as the density of triangles in the network (can also be a global measure)

  • not used so far

Distribution of network motifs — motifs are connectivity-patterns that occur more often than expected, usually expressed as a frequency distribution

  • not used so far

Properties affected by the whole network

Closeness — inverse of the summed shortest pathlengths to all other nodes, often averaged across all nodes

  • not used so far

Betweenness — number of inter-node shortest paths on which a node lies, often averaged across all nodes

  • not used so far

Node density — number of nodes per unit pathlength

  • not used formally, as far as I know, but phylogeneticists have consistently (and perhaps inappropriately) distinguished highly branched (speciose) parts of a tree from unbranched parts

Centrality — can be measured with respect to degree, closeness or betweenness

  • not used so far

Network diameter — either the average minimum distance between pairs of nodes, or the longest pathlength between any pair of nodes (relative to the number of nodes)

  • has sometimes made its appearance as a statistic in the phylogenetic literature
  • has been used as an optimality criterion for distance-based tree-building
  • if nothing else, the maximum diameter is used for mid-point rooting of a tree

Nestedness — quantifies whether the structure of small assemblages is a proper subset of the structure of large assemblages

  • a dichotomous tree is fully nested, and so nestedness has had a leading role in phylogenetics
  • nestedness could be used to measure the tree-likeness of a network

Fractal structure — quantifies the similarity of network structure at different scales

  • not used so far, although tree-imbalance (inversely related to fractal structure) has been an important measurement for trees

Network resolution — amount of information contained in the network (i.e. how much of the variation in node and edge behaviour is retained in the network representation) e.g. unrooted < rooted < rooted with variable edgelengths

  • of interest but usually not quantified
  • an unrooted tree/network cannot represent evolutionary history
  • use of variable edgelengths is common for rooted trees but not so far for rooted networks
  • variable edgelengths are used in unrooted networks

Conclusions

So, most of these measures have not yet played a significant part in the development of phylogenetics. Instead, phylogeneticists have concentrated on quantifying the fit of their data to the trees, such as the consistency index, retention index or permutation tests (for parsimony), likelihood scores (for ML) and posterior probabilities (for bayesian), or they have considered "support" for individual edges, via procedures such as the bootstrap, various parametric statistical measurements, and the posterior probability of clades.

This distinction between phylogenetics and biological networks seems, once again, to come from the different way that the networks are constructed. The other networks are usually constructed directly from observed objects and interactions, so that interest focuses on a description of the resulting network. Phylogenetic networks, on the other hand, are inferred via optimization of the data and a model, so that interest focuses on the quality of the inference rather than on a description of the network.

It seems likely, therefore, that this situation will continue, as most of these measures are specifically designed for describing empirically observed networks. However, the somewhat more nebulous concept of "network robustness" (the degree to which a network structure is affected by removal or alteration of nodes) has been seen as an important characteristic in the study of all biological networks.

As noted by Proulx et al. 2005: "The hope is that network approaches will ... reveal the global patterns behind large-scale ecological and evolutionary processes. The fear is that all of the fine structure will still matter in the end, leaving us tangled in detail."

References

Newman M.E.J. (2010) Networks: An Introduction. Oxford University Press, Oxford.

Proulx S.R., Promislow D.E.L., Phillips P.C. (2005) Network thinking in ecology and evolution. Trends in Ecology & Evolution 20: 345-353.

Monday, March 12, 2012

Tattoo Monday II


This week, we have some more ambitious designs for your phylogenetic tree tattoo: The Five Kingdoms, with some real biology attached to the matchstick diagram. You will note that both of the young persons are female, in this case. I am, sadly, yet to see a tattoo with bootstrap values or posterior probabilities, possibly indicating a lack of confidence.


Wednesday, March 7, 2012

RECOMB-AB


Last week my attention was drawn to the forthcoming conference RECOMB-AB 2012 : First RECOMB Satellite Conference on Open Problems in Algorithmic Biology:
 
“RECOMB-AB brings together leading researchers in the mathematical, computational, and life sciences to discuss interesting, challenging, and well-formulated open problems in algorithmic biology.”

As someone working in the field of “algorithmic biology” (which, I guess, could be defined as the application of techniques from computer science, discrete mathematics, combinatorial optimization and operations research to computational biology problems) I was, predictably, immediately enthusiastic about the conference.  

However, what really caught my attention was the following paragraph:

“The discussion panels at RECOMB-AB will also address the worrisome proliferation of ill-formulated computational problems in bioinformatics. While some biological problems can be translated into well-formulated computational problems, others defy all attempts to bridge biology and computing. This may result in computational biology papers that lack a formulation of a computational problem they are trying to solve. While some such papers may represent valuable biological contributions (despite lacking a well-defined computational problem), others may represent computational 'pseudoscience.' RECOMB-AB will address the difficult question of how to evaluate computational papers that lack a computational problem formulation.”

Calls-for-participation rarely strike such a negative tone. However, in this case I think the conference organizers have highlighted an extremely important point. Problems arising in computational biology are inherently complex and this entails a bewildering number of parameters and degrees of freedom in the underlying models. Furthermore, it is commonplace for computational biology articles to utilize a large number of intermediate algorithms and software packages to perform auxiliary processing, and this further compounds the number of unknowns (and the inaccuracies) in the system.

All this is, to a certain extent, inevitable. However, this complexity sometimes seems to have become an end in itself. This would be harmless except for the fact that scientists subsequently attempt to draw biological conclusions from this mass of data. Rarely is the question asked: is there actually any “biological signal” left amongst all those numbers? Would we have obtained similar results if we had just fed random noise into the system?

The fact that these questions are not posed, is directly linked to the lack of a clear and explicitly articulated optimization criterion.  In other words: just what are we trying to optimize exactly? What makes one solution “better” than another? What, at the end of the day, is the question that we are trying to answer? This is exactly what RECOMB-AB is getting at with the sentence, “This may result in computational biology papers that lack a formulation of a computational problem they are trying to solve”. The articulation might be slightly formal, but the point they raise is nevertheless fundamental.

It remains to be seen what kind of a role phylogenetic networks will play at RECOMB-AB, if any. For sure, the field of phylogenetic networks continues to generate a vast number of fascinating open algorithmic problems. However, are the underlying biological models precise enough to allow us to say that we are actually producing biologically-meaningful output? Overall, I think the answer is still no. However, I think that there is reason for optimism. The field is young and evolving and it is likely that both biologists and algorithmic scientists will have a significant role in shaping its future. Hopefully this interplay will allow us to move forward on the biological front without losing sight of the need for explicit optimization criteria.

Why do we still use trees for the dog genealogy?


In my previous two posts on Georges-Louis Leclerc, comte de Buffon, and his original dog genealogy of 1755, and the model for it, my interest was in Buffon's pioneering spirit in developing new ideas about genealogies and their presentation. However, it also seems natural to wonder how much we have progressed in the 250 years since then.

Having looked at the recent literature, there currently seem to be three distinct trends within dog phylogenetics:
  1. the study of whole-genome data, in which the results are presented solely as a neighbor-joining tree
      Parker et al. (2004)
      von Holdt et al. (2010)
  2. the study of mtDNA sequence data, in which the results are presented both as a tree and as a haplotype network
      Brown et al. (2011)
      Kropatsch et al. (2011)
      Oskarsson et al. (2012)
      Ryabinina (2006)
  3. the study of combined Y-chromosome and mtDNA sequence data, in which the results are presented solely as a haplotype network
      Leonard et al. (2002)
      Li et al. (2011)
      Pires et al. (2006)
      Savolainen et al. (2002)
      Savolainen et al. (2004)
      Sundqvist et al. (2006)
      Verginelli et al. (2005)
It is difficult to look at this list and not feel that there is a great deal of historical inertia here, regarding the choice of analysis method. People like Hans Bandelt have developed network methods explicitly for mtDNA data, such as median-joining and reduced-median networks; and the literature is replete with papers using these methods to analyze mtDNA sequences, especially the so-called "mitochondrial control region". On the other hand, these methods seem to be less commonly employed for other data types, where instead trees are de rigeur. So, people are apparently choosing their analyses based on historical convention within their field, rather than their suitability for the purposes at hand. Perhaps the papers where both methods are used should be seen as a compromise? Or should I be optimistic and see tham as part of a move away from trees towards the use of networks?

I have shown the two dog trees here. Both of them make it abundantly clear, even to the casual observer, that a tree is inappropriate for the data at hand.

Dog phylogeny (Parker et al. 2004) [Click to view]

The tree from Parker et al. has extremely small bootstrap values for almost all of the branches (only those >50% are shown on the tree), and even the group of modern dog breeds does not get up to 50% support. Clearly, there is massive conflict in this dataset. [Do not ask me why there is a value of 100% for the single branch at the base of the tree, since its presence is illogical.]

Dog phylogeny (von Holdt et al. 2010)

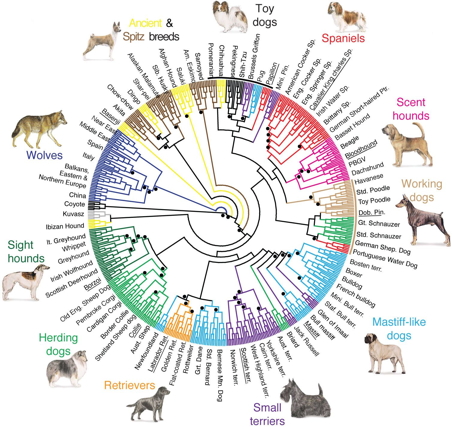
The tree from von Holdt et al. has broader coverage but is even more clearly non-tree-like. The dots indicate the branches with >95% bootstrap support and the colours indicate the 10 groups of dog breeds recognized by the Fédération Cynologique Internationale. As you can see, many of the breeds are scattered around the genetic tree, indicating cross-breeding in the genealogical history. This paper thus follows Buffon by nominating representative breed groups but fails by not showing the cross-breeding. So, it is drawn as a tree not a network, even when we know the history is not a tree. The use of colouring in the phylogenetic tree is one interesting way to indicate cross-connections in the genealogy, but cross-connecting lines is more explicit. [Interestingly, later editions of Buffon's work sometimes used hand-colouring of the genealogy to emphasize the breed groups that Buffon discusses in his text, so even this is not original.]

In both of these cases the tree analysis seems wildly inappropriate. As Buffon wisely told us 250 years ago, domestic dog breeds do not have a simple tree-like ancestry. It almost seems insulting that 2.5 centuries later we are still trying to fit these very same breeds (plus their numerous more-recent descendant breeds) into the straightjacket of a tree. We need to learn from the past if we are to progress into the future.

By the way, the patterns discussed here for phylogenetic analysis seem to be true for all groups of domesticated organisms. [You could try searching for the horse genealogy on the web, and you will see what I mean.] I am thus using the dogs merely as one convenient example. Following Andersen (1990), I do not intend "to pillory the few for errors which many commit with impunity".

Added note:
Since writing this post, another paper has appeared that can be added to group 1 (whole-genome data, with the results presented solely as a neighbor-joining tree): Larson et al. (2012).

References

Andersen B. (1990) Methodological Errors in Medical Research: an Incomplete Catalogue. Blackwell Science, Oxford.

Brown S.K. et al. (2011) Phylogenetic distinctiveness of Middle Eastern and Southeast Asian village dog Y chromosomes illuminates dog origins. PLoS One 6(12): e28496.

Kropatsch R. et al. (2011) On ancestors of dog breeds with focus on Weimaraner hunting dogs. Journal of Animal Breeding and Genetics 128: 64–72.

Larson G et al. (2012) Rethinking dog domestication by integrating genetics, archeology, and biogeography. Proc Natl Acad Sci USA 109: 8878-8883.

Leonard J.A. et al. (2002) Ancient DNA evidence for Old World origin of New World dogs. Science 298: 1613–1616.

Li Y. et al. (2011) The origin of the Tibetan Mastiff and species identification of Canis based on mitochondrial cytochrome c oxidase subunit I (COI) gene and COI barcoding. Animal 5: 1868-1873.

Oskarsson M.C.R. et al. (2012) Mitochondrial DNA data indicate an introduction through mainland Southeast Asia for Australian dingoes and Polynesian domestic dogs. Proceedings of the Royal Society B 279: 967-974.
Parker G. et al. (2004) Genetic structure of the purebred domestic dog. Science 304: 1160-1164.

Pires A.L. et al. (2006) Mitochondrial DNA sequence variation in Portuguese native dog breeds: diversity and phylogenetic affinities. Journal of Heredity 97: 318-330.

Ryabinina O.M. (2006) Genetic diversity and phylogenetic relationships in groups of Asian Guardian, Siberian Hunting and European Shepherd dog breeds. Proceedings of the Fifth International Conference on Bioinformatics of Genome Regulation and Structure, Volume 3, 50.

Savolainen P. et al. (2002) Genetic evidence for an East Asian origin of domestic dogs. Science 298: 1610–1613.

Savolainen P. et al. (2004) A detailed picture of the origin of the Australian dingo, obtained from the study of mitochondrial DNA. Proc Natl Acad Sci USA 101: 12387-12390.

Sundqvist A.-K. et al. (2006) Unequal contribution of sexes in the origin of dog breeds. Genetics 172: 1121–1128.

Verginelli F. et al. (2005) Mitochondrial DNA from prehistoric canids highlights relationships between dogs and south-east European wolves. Molecular Biology & Evolution 22: 2541-2551.

von Holdt B.M. et al. (2010) Genome-wide SNP and haplotype analyses reveal a rich history underlying dog domestication. Nature 464: 898-902.

Tuesday, March 6, 2012

Biological versus phylogenetic networks


Networks have recently begun to receive serious attention in nearly all areas of biology. There has been a new focus on complex networks embedded within biological systems; and the mathematical properties of those networks are now being actively studied. In this sense, the interest in phylogenetic networks is simply part of a much larger movement.

An important point, however, is whether the characteristics of the different biological networks have anything in common. The nodes, for example, can represent units at all levels of the biological hierarchy, from elements, through organic and inorganic compounds, to tissues, organs, individuals, populations, species, communities and ecosystems. The edges (or arcs) represent all sorts of interactions between the nodes, including transcriptional control and other biochemical processes, energy and nutrient flow, behavioral interactions, and genetic or genealogical relationships.

Does this complexity mean that we have networks of fundamentally different type, or do the networks differ only in a few mathematical details? Importantly for our purposes, are phylogenetic networks essentially different from other biological networks? If so, then developments elsewhere do not necessarily flow on to us. Indeed, phylogenetic networks seem to be unknown to many network biologists. For example, phylogenetics is not even mentioned in this review paper, which implies some sort of disconnection: Proulx, Promislow, Phillips (2005) Network thinking in ecology and evolution. Trends in Ecology & Evolution 20: 345-353.

I will argue here that, indeed, phylogenetic networks do not match any other type of biological network.

Network Characteristics

First, we can list some of the important characteristics of phylogenetic networks if they are to represent evolutionary history, and then consider them individually:

  1. fully connected
  2. directed
  3. single root
  4. each edge (arc) has a single direction
  5. no directed cycles
  6. in species networks the internal nodes are usually unlabelled, although in population networks some / many of them may be labelled.

Most other biological networks can be disconnected, at least potentially, because the definition of the nodes to be included in the network is often independent of the network itself, so that there is no necessary connection between nodes. For example, the species within a local community may not all be connected to each other with respect to the characteristic being studied (eg. genetic relatedness). Indeed, finding this out may be a primary goal of any particular study. Similarly, molecular compounds usually form at least semi-independent sets of pathways, so that the study of any one organ can produce disconnected networks. With evolutionary history, on the other hand, all conceivable nodes are connected to each other by definition (unless there are multiple origins and subsequent history of life in the Universe).

Protein interaction network

In order to represent history, which has a single time direction, a phylogenetic network must have directed edges (arcs) to represent the time course. Many other biological networks have no explicit direction, even if there is an implied one. For example, in protein-protein interaction networks the edges represent the presence of physical interactions between proteins (with no implied direction), and in genetic-relationship networks the edges simply represent the degree of genetic relatedness of individuals (eg. the link between siblings has no explicit direction, although there is an implied directional link to their parents).

In a phylogeny there is usually a single root, because phylogeneticists try to work on monophyletic groups (clades); and if they really do want to study the Tree of Life then there is assumed to be a single origin of life in the Universe. Once again, for other networks the definition of the included nodes is often independent of the network or its shape, so that a single root is not necessary. For example, networks of regulatory interactions among genes are often represented with the nodes around the perimeter of a circle with the edges being chords. Furthermore, in food webs the arcs represents who eats whom, and these networks are called "webs" for a good reason: there is usually no obvious root position. Indeed, the usual representation of a food pyramid starts with multiple sources (at the bottom) and a single sink (at the top), with the arc directions indicating "is eaten by".

Gene regulatory network

Also, many biological networks have directed cycles. For example, the feedback loops in biochemical pathways are usually important (as sometimes are feedforward loops). Indeed, the discovery of feedback has been considered to be a major contribution to our understanding of why biological systems are different from non-biological ones. The recycling of nutrients in ecosystem nutrient pathways is another prominent example, although no feedback is involved in this case. Once again, the recognition that the Earth is effectively a closed system with finite resources that must be reused is considered to be a major contribution by biology.

Moving on, many networks have bidirectional arcs, indicating direct interactions between nodes. Indeed, many behavioral systems show this feature, including intra- and inter-competition networks in ecology as well as sexual-contact networks (which, incidentally, have two distinct types of nodes). Immunological networks often have this characteristic, as well, with the arcs pointing in one direction or the other at different time points during a cell's immunological reaction to a stimulus. (These networks also can have nodes with arcs that point directly back to themselves, indicating that a molecule regulates itself.) Host-parasite systems can also be considered to have bidirectional arcs, although in this case the paired arcs represent different processes (the effect of the parasite on the host and the host on the parasite operate via different mechanisms). In this case, two separate arcs are usually used, rather than a single bidirectional one, thus representing a directed cycle.

Predator-prey systems may, on occasion, match phylogenetic networks. If we isolate the predator-prey relationships from all of the others in a food web then a single tree-like structure sometimes emerges, with a single "key" predator at the root and a series of non-predators at the leaves. However, more often there are several "root" predators within any one community predator-prey network. Similarly, disease-transmission networks can be tree-like if there is a single identifiable origin to an epidemic, for example, but not otherwise. Note that the internal nodes are all labelled in both of these types of network, so that they will match a population network rather than a species network.

HIV partner network

Conclusion

Almost all types of biological networks are built by starting with a labelled set of nodes and then directly linking those nodes with edges — phylogenetic networks seem to be the only major class of biological networks in which some or many extra nodes are inferred by the network-building process. That is, almost all other networks are built empirically, by using a collection of observed nodes and connecting them via observed edges ("observed" indicating that there are experimental data). Phylogenetic networks, on the other hand, attempt to reconstruct unobserved (and unobservable) historical relationships using data, a model and a mathematical optimization procedure.

So, I have been unable to think of any other biological networks that do match all of the important characteristics of a species network. Perhaps some of you may be able to come up with a good example?

Update: This later post considers the summaries used for biological networks and whether they apply to phylogenetic networks.

Monday, March 5, 2012

Tattoo Monday


Sometimes, we need a light-hearted way to start to the week, and this blog is the place to find it. Each Monday we will have a view of the lighter side of phylogenetics.

This week we have some inspirational ideas for modern phylogeneticists, who have confidence in the robustness of their tree. However, this sort of project should not be undertaken too early in one's thesis work, in case of a last-minute addition to the dataset. You also need to pick the right colours for your tattoo, because some of them are rather hard to remove, should you change your mind.


You can also check out all of the other phylogeny tattoos collected on our Tattoos page.

Friday, March 2, 2012

Can networks have multiple roots?


The biological model behind most phylogenetic networks is the same as the one behind most phylogenetic trees, in which there is a series of branches ramifying from a single base, with the additional feature that branches can fuse with each other.


In this model, attention has focussed on the osculations ("kissing") between branches. However, I wish to draw your attention to the base of the tree, where in some biological models multiple stems appear. These stems represent multiple origins for the organisms being modelled.


The idea is, simply, that life is not monophyletic, and nor are some of the commonly recognized taxonomic groups. This model appears most famously in the paper by Doolittle (1999), but it's basic premise has been repeated a number of times (eg. Doolittle 2000a, from which the above figures are taken; Wells 2002).


Doolittle (2000b) credits the biological idea to Woese & Fox (1977), as further developed by Woese (1987, 1998), so the idea is not a particularly recent one. The premise is that "... the three contemporary domains of life arose not from a single cell, but from a population of very different cellular entities ('progenotes') ... such a population [could] give rise to two (and then three) discrete cellular domains without passing through a bottleneck represented by a single cellular universal ancestor" (Doolittle 2000b).

There is, of course, a biological precedent for this multiple tree model: the "Husband and Wife tree" or "Marriage tree", which is formed from two trees that have branches conjoined by the process known as self-grafting (or osculation). Here, there literally are two trunks and roots, since the conjoined structure starts as two separate trees.

Inosculated (self-grafted) crab apple trees, Lynncraigs farm, Scotland

My question, though, is this: Can the mathematics of phylogenetic networks handle multiple roots? All current definitions that I have seen of phylogenetic networks specify a single root node with indegree 0. However, I have seen no discussion of this point in the literature, as to the necessity of this imposed mathematical constraint.

References

Doolittle W.F. (1999) Phylogenetic classification and the universal tree. Science 284: 2124-2128.

Doolittle W.F. (2000a) Uprooting the tree of life. Scientific American 282(2): 90–95.

Doolittle W.F. (2000b) The nature of the universal ancestor and the evolution of the proteome. Current Opinion in Structural Biology 10: 355-358.

Wells J. (2002) Icons of Evolution: Science or Myth? Regenery Publishing, Washington DC.

Woese C.R. (1987) Bacterial evolution. Microbiological Reviews 51: 221-271.

Woese C.R. (1998) The universal ancestor. Proceedings of the National Academy of Sciences of the USA 95: 6854-6859.

Woese C.R., Fox G.E. (1977) The concept of cellular evolution. Journal of Molecular Evolution 10: 1-6.

Thursday, March 1, 2012

Buffon's genealogical ideas

Following on from my earlier post about the network genealogy of dogs by Georges-Louis Leclerc, comte de Buffon (1707-1788), it seems appropriate to mention some other notable aspects of his treatment of the dog genealogy.

Buffon is usually considered to have been a remarkable man, whose influence on modern evolutionary science has been profound: "Except for Aristotle and Darwin, there has been no other student of organisms who has had as far-reaching an influence" (Ernst Mayr. 1982. The Growth of Biological Thought: Diversity, Evolution, and Inheritance). He was greatly influenced by Isaac Newton, who sought to describe the workings of nature as being under the control of natural forces. Buffon successfully applied this idea to biology and geology, so that "after Buffon it became impossible for naturalists to refer uncritically to non-natural explanations for natural phenomena" (Keith R. Benson. 2004. Encyclopedia of the Early Modern World).


Buffon's multi-volume Histoire naturelle générale et particulière was intended to describe all of nature rather than merely to catalogue it, as was being done so successfully by his contemporary Carl von Linné (1707-1778). He started with geology in the first few volumes of the Histoire, and then proceeded on to domesticated animals. The coverage of dogs was preceded in the same volume (V) by sheep, goats and pigs; with horses, asses, cows and bulls being in the previous volume (IV), and cats in the subsequent volume (VI).

Dogs were domesticated from the Gray Wolf at least 10,000 years ago, and dogs similar to some modern breeds appeared at least 4,000 years ago. Genetic analyses indicate that most modern breeds have arisen probably <200 years ago (and almost certainly <400). So, Buffon had less material to work with (and explain) than we do, especially given his lack of knowledge about the numerous types of "village dogs" in Africa and Asia.

Buffon's Ideas

Buffon recognized 30 “fixed varieties” and 17 “variable races”, grouped into four main functional / geographic classes. The Fédération Cynologique Internationale (World Canine Organization) currently recognizes ~350 breeds of dog, classified into 10 groups according to their domesticated function and, to a lesser degree, area of origin; so Buffon's basic approach to the subject continues today.

Moreover, Buffon nominated what may be called "progenitor breeds" for each class, with the remaining breeds within each class being derived from that progenitor. This matches our current understanding of domestication, with ~10 progenitor breeds being originally developed to fulfill different roles required by humans (e.g. herding, retrieving, hunting), and then today's pure breeds being derived from those progenitors during the subsequent few millenia. So, our current understanding of the origin of dog genetic variation is essentially the same as that adopted by Buffon. He was, in this sense, an influential pioneer.

Buffon's use of a network to visualize his ideas on genealogy seems to be entirely original. Interestingly, his use of solid lines in the network to represent the underlying tree of vertical descent (parent to offspring) and dashed lines to represent the horizontal genealogy of cross-breeding (hybridization) is the precursor to much modern practice. Most of the contemporaneous networks, which represented similarity relationships rather than historical ones, treated all linkages as equal.

Buffon did, by modern reckoning, get the details of the network root wrong. He nominated the "Shepherd Dog" as the root, and also as being part of a group with the Icelandic Sheepdog, Lapland Dog and Siberian Husky. We do not now include sheepdogs in that group, but these other dogs are today considered to be part of the sister group to all other modern breeds. So, Buffon's idea was along the right track.

Furthermore, Buffon expected the wolf to be the natural ancestor of modern dogs, which accords with modern genetic data showing wolves to be the sister group to all dogs. However, Buffon, failed in his experimental attempts to cross-breed dogs and wolves (he would never have gotten his described experiments past an ethics committee!), and also dogs with foxes. So, he concluded that the "dog derives not his origins from the wolf or fox." Nevertheless, he still maintained that "Each one of these species is truly so close to the others" and the "individuals resemble each other so much . . . that one has difficulty conceiving why these animals cannot reproduce together." This persistence was soon vindicated, when a "Mr Brook, animal-merchant of Holborn" did succeed in cross-breeding a female dog and a male wolf [as reported in William Smellie's English translation of Buffon's work].

Buffon did, however, have one major stumbling block. He believed in the fixity of species, and so the diversity of modern domestic breeds required careful thought on his part. He had no problem with the idea that a mule is the sterile offspring of a donkey and a horse, but the fertile inter-breeding of a wide morphological variety of domestic dog breeds put a great strain on the idea of fixed species. He thus settled on a theory of transmutation of domesticated animals in response to environmental effects. For example, when one dog breed is transported to a different climate it changes into a different type of dog. [It's unclear if he thought that the actual animal changed, or if it's offspring were born in this new form.] This idea was taken up by Buffon's intellectual successor Jean-Baptiste Pierre Antoine de Monet, Chevalier de Lamarck (1744-1829), who applied a much broader version of the same idea to natural species as well as to domesticated ones.

It is worth noting that Buffon's transmutation idea was not actually crazy. He was simply being a consistent Newtonian by attributing a common cause to diverse phenomena. Since it was known that different geographical areas have different floral and faunal assemblages, Buffon attributed to the same environmental factors variation due to both geography and domestication. Indeed, by relating biodiversity to environment Buffon has actually been seen as the father of modern biogeography (Mayr 1982).

Conclusion

So, it seems top me that Buffon did remarkably well when presenting his ideas about the dog genealogy. He pioneered some things, got others basically right but missed in the details, and really got only one idea fundamentally wrong. His idea of a transformable "moule intérieur" was the best he could come up with in the absence of any idea about genetics, but surely he would have understood modern genetics very well if he had lived to see it.