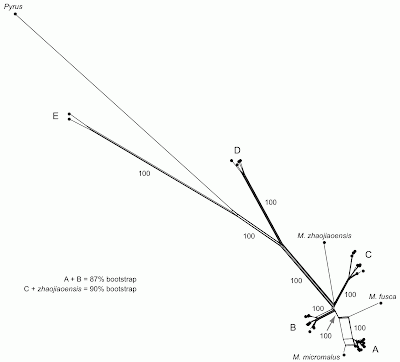
As is always emphasized in this blog, it is best to explore the nature of any phylogenetic dataset, before proceeding to a formal data analysis. Usually, I discuss examples where important insights are revealed by using a phylogenetic network as a form of Exploratory Data Analysis. Here, instead, I note an example where there are few noteworthy features, in addition to those emphasized by the phylogenetic tree — some datasets really are tree-like.
The paper under discussion is:
Nikiforova S.V., Cavalieri D., Velasco R., Goremykin V. (2013) Phylogenetic analysis of 47 chloroplast genomes clarifies the contribution of wild species to the domesticated apple maternal line. Molecular Biology & Evolution 30: 1751-1760.
The data involve 47 chloroplast genomes from cultivated apple varieties and wild apple species (genus Malus). The nucleotide alignment is 134,553 bp; and the dataset is available in the Dryad database.
The authors did check some of the basic assumptions of their proposed phylogenetic analysis, such as whether the nucleotide substitutions are saturated and whether the nucleotide composition is homogeneous. The authors conclude that the data are very well-behaved: the alignment is unproblematic, so there is no ambiguity about homology; the P-distances = the corrected distances, so that it is unimportant which nucleotide substitution model is chosen; the nucleotide composition is homogeneous; and most of the site variation is binary. The authors conclude that: "phylogenetic signal is well preserved in the data and is not distorted by multiple substitutions and strong compositional bias."
This does not, however, examine whether the phylogenetic signal is tree-like or not. This is best done with a phylogenetic network. So, I have used a NeighborNet network based on the P-distances, as shown below.
 |
| NeighborNet network, with some of the labels (names and bootstrap values) reproduced from the original tree. |
In their tree-based analysis (a bootstrapped maximum-likelihood tree) the authors recognize five monophyletic groups (labeled A to E) plus the outgroup Pyrus. The network reveals that the major groups (A–E) are tree-like except for three things:
- the A + B grouping has 87% bootstrap support in the tree-based analysis but is not supported by the network analysis;
- the grouping of M. zhaojiaoensis with group C has 90% bootstrap support in the tree-based analysis but is not supported by the network analysis;
- the relationship of M. fusca and M. micromalus to group A is not clear in the network.
For point (3), the tree-building analysis makes a somewhat arbitrary decision to resolve the conflicting relationships — it shows M. fusca as the sister to group A, but it includes M. micromalus within the group.
Otherwise, the authors' confidence in their tree-based results seems to be well justified.


No comments:
Post a Comment