Showing posts with label Incongruence. Show all posts

Monday, September 14, 2020

Exploring the oak phylogeny

Neighbor-nets are a most versatile tools for exploratory data analysis, including phylogenetics. They are not only fast to infer, but possibly most straightforward in depicting the signal in one's data matrix — this is called Exploratory Data Analysis. EDA makes them useful additions to any phylogenetic paper, because it gives the reader (and peers and editors during review) a good idea what the data can possibly show, and where there may be problems.

A nice example of this use is the Neighbor-net in a recent paper on Chinese oaks:
Yang J, Guo Y-F, Chen X-D, Zhang X, Ju M-M, Bai G-Q, Liu Z-L, Zhao G-F. Framework Phylogeny, Evolution and Complex Diversification of Chinese Oaks. Plants 2020: 1024.
[Note: The paper is, from a purely methodological point-of-view, pretty well done, but has probably not experienced any real peer-review.**]
Oaks (Quercus L.) are ideal models to assess patterns of plant diversity. We integrated the sequence data of five chloroplast and two nuclear loci from 50 Chinese oaks to explore the phylogenetic framework, evolution and diversification patterns of the Chinese oak’s lineage. The framework phylogeny strongly supports two subgenera Quercus and Cerris comprising four infrageneric sections Quercus, Cerris, Ilex and Cyclobalanopsis for the Chinese oaks.
None of this is new. My colleagues and I published an updated classification for oaks a few years ago (Denk et al. 2017) that took into account molecular phylogenies, and introduced the systematic concept referred to by Yang et al., and recently followed by a many-species global oak phylogenomic study (Hipp et al. 2020). All of this is based on nuclear data only, because any researcher who ever studies oak genetics soon realizes that the plastomes are largely decoupled from speciation processes, but are geographically highly constrained (eg. Simeone et al. 2016, Yan et al. 2019). This is the reason why oaks are indeed "ideal models to assess patterns of plant diversity" – they provide a worst-case scenario not the (trivial) best-case one.

As can be seen in the Yang et al. tree, members of section Ilex, a monophyletic lineage forming highly supported clades in trees based on nuclear data, are scattered all across the subgenus Cerris subtree. I have annotated a copy of this tree here.

Yang et al.'s fig. 1a, with some clades newly labeled for orientation

Because of the plastid incongruence, the subgenus Cerris subtree has a wrong root (section Cylcobalanopsis diverged before sister sections Cerris and Ilex split). Also, the reciprocally monophyletic, genetically coherent sections Cerris (green) and Cyclobalanopsis (blue) are embedded in the much more diverse Ilex 3 and Ilex 4 clades. The remaining Ilex species are placed in two early diverged clades, which I have labeled Ilex 1 and Ilex 2 in the above tree (note: the taxon set only includes Chinese oak species). The only indication the tree gives that we have a data conflict issue is the low support (gray circles represent branches with Maximum likelihood bootstrap support > 60).

The network

When interpreting the phylogenetic implications of a Neighbor-net, we have to keep in mind that it is not a phylogenetic network in the strict sense (ie. displaying an evolutionary history), but is instead a meta-phylogenetic graph: a summary of incompatible splits patterns. Incompatibility can have different origins: reticulation, recombination, diffuse or poorly sorted signals, etc. Consequently, when looking at a Neighbor-nets and their neighborhoods (Splits and neighborhoods in splits graphs), we need to keep in mind what kind of data we used to calculate the underlying distance matrix in the first place.

If the data follows two incongruent trees ("phylogenies"), as in this case for the oaks, the Neighbor-net has a good chance of capturing the incompatible splits of both genealogies. Here is the graph from the paper.

Wang et al.'s fig. 1b.

The central inflated portion of the graph reflects the incongruence between the combined data sets: we have overlapping nuclear-informed and plastid-informed neighborhoods.

The authors' brackets (shown in black) refer to neighborhoods triggered by the two nuclear markers in the data set: these are neighborhoods reflecting the common origin and speciation within the oak lineages. We can even see that this signal, which is incompatible with all deep splits in the combined tree, is unambiguous in part of the data (the nuclear partitions): section Ilex spans out as a wide fan, but there is a relatively prominent edge bundle defining the according neighborhood (the blue split).

The net shows additional, even more prominent edge bundles defining partly overlapping or distinct neighborhoods (the red splits). These neighborhoods are represented as clades in Yang et al.'s phylogenetic tree (fig.1a). They write (p. 11 of 20):
However, the conflict between the two datasets seems to be recovered by the neighbor-net method in this study, as the neighbor-net network based on combined plastid–nuclear data strongly shows the presence of two subgenera and four infrageneric species groups for the Chinese oak’s lineage (Figure 1b).
Interestingly, the authors nonetheless used the substantially incongruent combined data for downstream dating and trait mapping analysis (p. 7/20):
Bayesian evolutionary analyses provided a concordant infrageneric phylogeny for the Chinese oak’s lineage at the species level (Figure 2).
This uses a taxon-filtered, obviously constrained (fixed) topology, fitted to the current synopsis outlined in Denk et al. (2017). [Note: the supplement includes the extremely incongruent nuclear and plastid trees, each of which has further incongruence issues because they combine fast- and very slow-evolving sequence regions.]

Postscript

More posts on oaks, plastid data and networks can be found here in the Genealogical World and in my Res.I.P. blog.

Cited papers

Denk T, Grimm GW, Manos PS, Deng M, Hipp AL. (2017) An updated infrageneric classification of the oaks: review of previous taxonomic schemes and synthesis of evolutionary patterns. In: Gil-Pelegrín E, Peguero-Pina JJ, and Sancho-Knapik D, eds. Oaks Physiological Ecology. Cham: Springer, pp. 13–38. Open access Pre-Print [major change: Ponticae and Virentes accepted as additional sections in final version].

Hipp AL, Manos PS, Hahn M, Avishai M, + 20 more authors. (2020) Genomic landscape of the global oak phylogeny. New Phytologist 229: 1198–1212. Open access.

Simeone MC, Grimm GW, Papini A, Vessella F, Cardoni S, Tordoni E, Piredda R, Franc A, Denk T. (2016) Plastome data reveal multiple geographic origins of Quercus Group Ilex. PeerJ 4:e1897. Open access.

Yan M, Liu R, Li Y, Hipp AL, Deng M, Xiong Y. (2019) Ancient events and climate adaptive capacity shaped distinct chloroplast genetic structure in the oak lineages. BMC Evolutionary Biology 19:202. Open access.


** The publisher, MDPI, thrives in the gray zone between predatory and accredited publishing. Originally included in the recently reactivated Beall's List (new homepage), it has been tentatively dropped (see the linked Wikipedia article; but see also this post by Mats Widgren). Personally, I have encountered articles published in MDPI journals only where the review process must have been, at least, strongly compromised. But it's always quick: Yang et al.'s paper was submitted July 24th, accepted August 12th, and published a day later. Three weeks is about the length of time that the editors of my first oak paper needed to find a peer reviewer at all.

Monday, June 22, 2020

Can we dig too deep? Signal conflict in mitochondrial genes of land plants


In an earlier post, Supernetworks and gene tree incongruence, I illustrated what Supernetworks can tell us about incongruent mitochondrial gene trees, using the dataset of Sousa et al. (PeerJ 8: e8995, 2020). Here, I will take a closer look at these data, in order to illustrate another point.

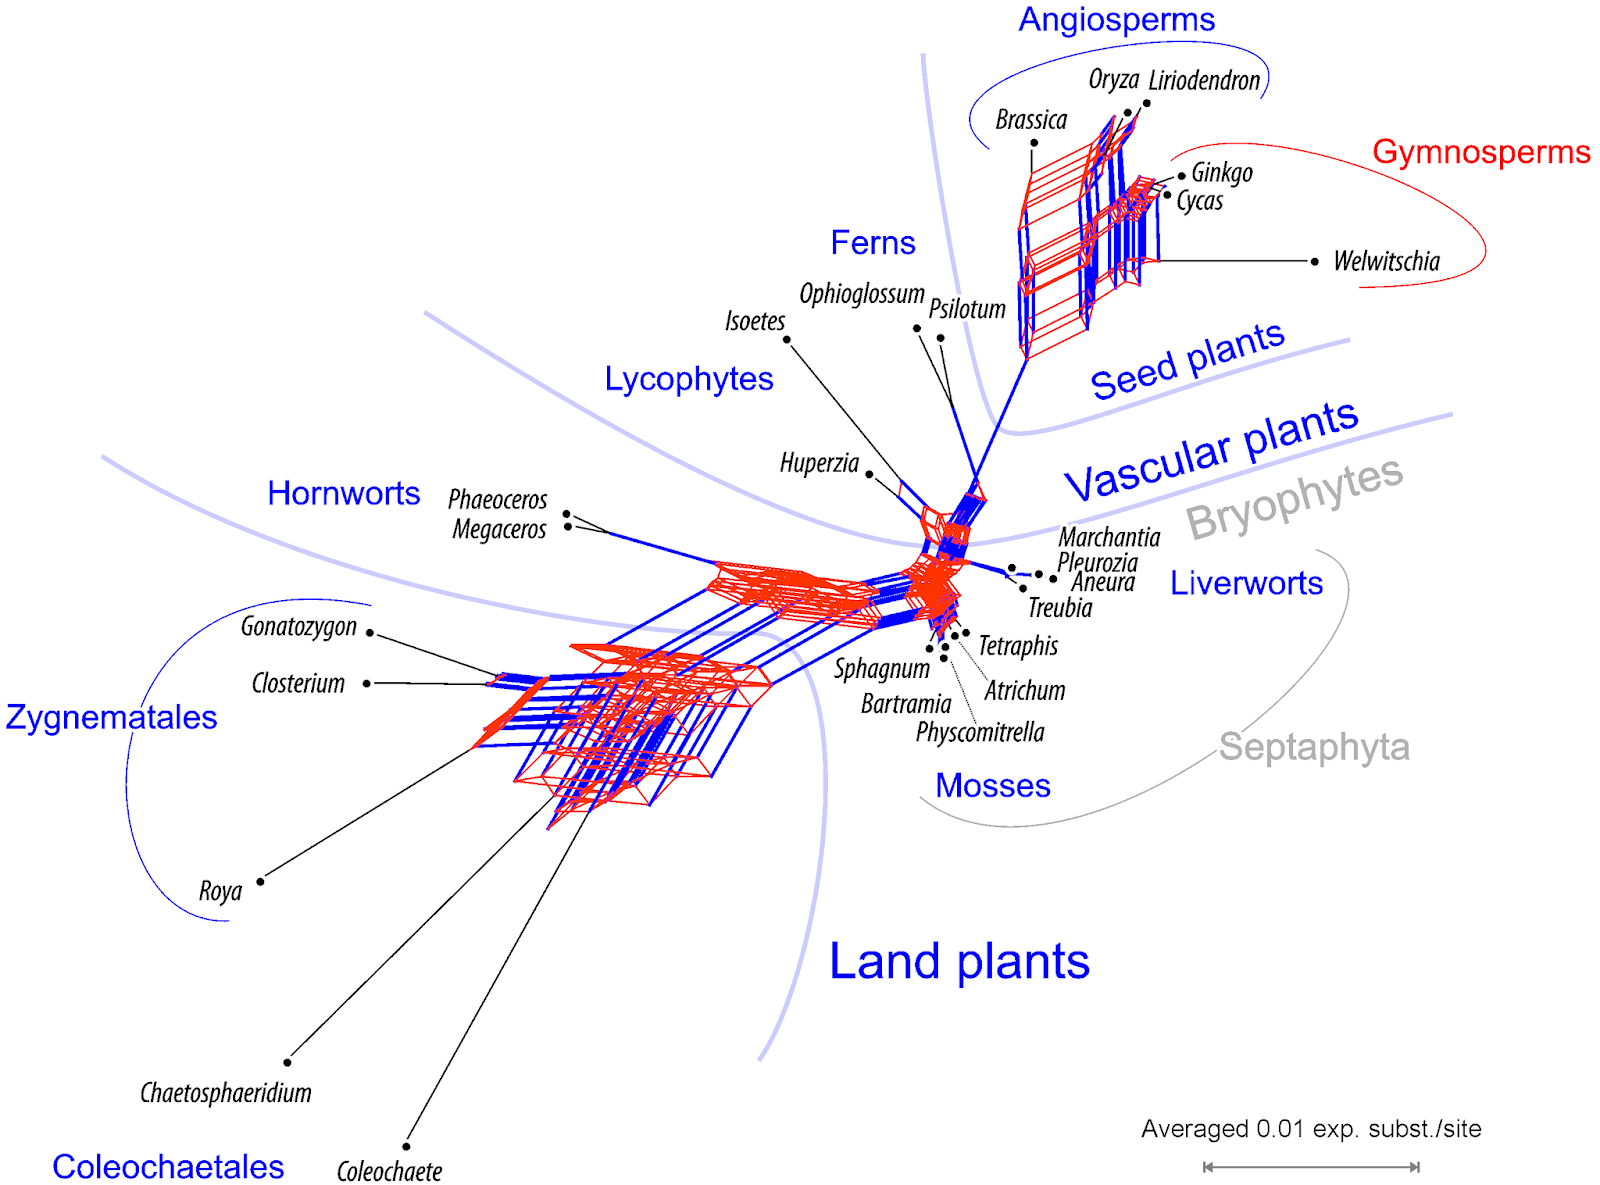
Fig. 1 A Supernetwork based on 34 individual mitochondrial gene trees (atp1 and atp8 missing due an alignment glitch). Groups (clades) referring to splits not found in any of the gene trees, including the "Septaphyta", are shown in gray font, in blue, groups referring to clades seen in Sousa et al.'s preferred tree.

Sousa et al.'s set of analyses aimed to filter signal in order to get a better all-inclusive tree, and succeeded to produce support for a "Septaphyta" clade, comprising liverworts and mosses, which is a split not found in any of the inferred (Bayesian) gene trees.

Fig. 2 Comprehensive but branch-length and frequency ignorant Supernetwork of Sousa et al.'s Bayesian MRC gene trees (trees are provided as supplementary online data on zenodo), inferred from nucleotide sequences. The trees show several alternatives (colored and labeled) regarding the sister lineages of mosses and liverworts. Any split found in at least one gene tree, is represented in this Supernetwork.

This split did occur, however, when the amino acid sequences were used, instead of the nucleotide sequences.

Fig. 3 Comprehensive branch-length and frequency ignorant Supernetwork of Sousa et al.'s amino acid Bayesian MRC gene trees. The sister taxon of liverworts are either the mosses (= Septaphyta clade) or the outgroup green algae Coleochaete (further inclusive splits include subsequently more outgroups, placing the liverworts as sister to all other land plants). Realized alternatives for mosses include further being a sister of hornworts (in which case liverworts would be sister to higher land plants), or sister to all land plants (brown split: green algae + mosses | rest).

The alternative to the Septaphyta clade, which does appear in the gene trees, recognizes the liverworts as the closest relative of the vascular plants, while the mosses are resolved as the first branch. As Sousa et al. point out:
The tree inferred from the concatenated nucleotide data set of 36 mitochondrial genes shows mosses as the sister-group to the remaining land plants, as previous analyses of mitochondrial nucleotide data have shown (Liu et al., 2014). ...
The concatenated tree hence only reflects a minor aspect of the Supernetwork (Fig. 1) of the individual gene trees:
... However, the mosses are replaced by the liverworts in the same position when analysing codon-degenerate recoded data.
This seems to be the preferred placement when summarizing the gene trees using the Supernetwork.

In this post, we will take a closer look. Is there a deep, easily obscured signal for the Septaphyta clade in the mitochondria of plants? A signal that only surfaces in some amino acid gene trees (Fig. 2) and the filtered concatenated tree (Sousa et al.'s fig. 2), or is it just a branching artifact?

An example for a (low-supported) artificial clade (cf. Schliep et al., Methods Ecol. Evol. 8: 1212–1220, 2017). The trees in (a), (b) and (c) give the paternal (Y-chromosome), maternal (mt genes) and biparental (nuclear autosomal introns) genealogies. While the paternal and biparental genealogies are compatible (congruent), the maternal is in strong conflict. When combining these three data sets, this substantial conflict decreases branch support and results in the artificial red clade. The support for the artificial clade is low but worrisome: the tips differ substantially from each other and the hypothetical, alternative common ancestors and there are literally no patterns in the data supporting a sister relationship of Sloth and Sun bears. The artificial red clade is a secondary product of the inference: the sister relationship of Polar and Brown Bear is trivial (data and inference wise), the American Black Bear the more likely sister (note the length of competing branches in a/c vs. b). The signal for a clade of Asian Black and Sloth bears is less pronounced, here the mt genealogy clade is strongly incongruent and forces the combined tree to resolve the conflict by introducing the artificial red clade.

Starting simply

The Supernetwork in Fig. 1 shows that, no matter which gene we look at, liverworts and mosses were originally most similar to each other, and, absolutely speaking, still close to the (hypothetical) mitochondrion of the ancestor of all land plants. We can illustrate the general situation about the signals using a Neighbor-net inferred from the concatenated data of all 36 genes.

Fig. 4 Neighbor-net based on uncorrected p-distances inferred from the concatenated gene data.

Note that we used a substitution model via a naive distance matrix for a set of coding genes that include saturated third codon positions. Some phylogenetic relationships are obviously based on trivial signals: the Neighbor-net in Fig. 4 includes ± prominent edge bundles defining neighborhoods in line with generally accepted clades (in bold). To capture these evolutionary lineages (some going back nearly half a billion of years), we just need the raw data but no sophisticated phylogenetic analysis.

In the case of the probably monophyletic gymnosperms, the gymnosperm neighborhood competes with a neighborhood excluding the Gnetidae Welwitschia, which is the most distinct of the seed plants in this taxon set (this applies to Gnetidae in general, no matter which data are used). In addition, we see a neighborhood defined by the pink edge bundle: a split of green algae + Welwitschia versus all other land plants. This is a case of obvious long-edge attraction, enforced (here) by missing data (Welwitschia lacks data for 12 out of the 34 genes).

The center of the graph with respect to all tips would be a candidate for the ancestral mitochondrion of the common ancestor of all land plants. Closest to this point are the Septaphyta (mosses + liverworts) and the lycophyte Huperzia (the better represented taxon only missing out on five genes, while Isoetum miss 15).

One can depict a phylogenetic hypothesis by just dropping the less pronounced neighborhoods in Fig. 4:
  • Most prominent edge bundles define three main cluster (= lineages): green algae, seed plants, and other land plants.
  • Within green algae:
    • Closterium is sister to Gonatozygon, next is Roya → Zygnematales
    • there is no prominent edge bundle connecting Chaetospharidium with the Zygnematales; the closest relative is however the last green algae (→ Coleochatales; only group without a neighborhood).
  • Within seed plants:
    • Brassica may be the sister of Liriodendron (more prominent edge bundle), Oryza complements the clade as first diverged member → angiosperms
    • Cycas is the sister of Gingko, the two are sister to the angiosperms
    • this leaves Welwitschia as the first diverged branch.
  • Taking the green algae as outgroups:
    • the ferns are the sister group of the seed plants (edges longer than the alternative of a primitive land plant clade)
    • mosses are sister to liverworts (→ Septaphyta); Huperzia shares the same edge bundle but is apparently sister of Isoetes (→ lycophytes), and the lycophytes appear to be ± primitive sisters of ferns and seed plants
    • this leaves the hornworts, a highly coherent group sharing no prominent edge bundles with any other member of the land plant cluster, and hence are a candidate for the first diverging land plant lineage.
This is a tree hypothesis that is strikingly similar with Sousa et al.'s preferred tree.

Sousa et al.'s fig. 2

The only differences lie in terminal subtrees (Oryza as sister to Liriodendron; Marchantia-Treubia grade, the position of the latter two within liverworts being unclear based on the Neighbor-net).

Something that is easily overlooked in Sousa et al.'s rooted tree, but that is apparent from the Neighbor-net, is that we should be aware of ingroup-outgroup long-branch attraction (LBA). The green algae are not only highly divergent but also very distant from all ingroup taxa, the land plants.; and the first ingroup branch in Sousa et al.'s tree has the longest root.

Additive and subtractive support

In principal, when comparing single gene tree samples to combined trees, we face four sorts of signals in our data:
  • Very strong signals imprinted in one or a few genes; they will outcompete, and possibly even be re-enforced by any conflicting signal. Walker et al. (PeerJ 7: e7747, 2019), studied this phenomenon for the case of angiosperm plastomes (see also our miniseries The emperor has no clothes on).
  • Phylogenetically sorted, weak but consistent signals; they will add up, as branch support will increase with each gene added. In this category fall signals reflecting deep splits obscured by terminal noise, when analyzing a single gene or few genes – like the one found by Sousa et al. supporting a Septaphyta clade.
  • Disparate gene histories; eg. because of intergenomic recombination. The support will be diminished with every added gene not sharing the same history.
  • General conflict; eg. when combining data from different genomes reflecting different genealogies, such as combining chloroplast (product of biogeographic history) and nuclear data (product of speciation processes) of tree genera. This will be expressed by split bootstrap (BS) support, and may result in artificial clades in the combined/concatenated tree (eg. bear example shown above).
Adding to this is the absence of signal: short-branch culling, a special case of long-branch attraction, which could also explain the inference of a (paraphyletic) Septaphyta clade. If there are few tips in the data that are close (absolute, not only regarding their phylogenetic distance) to the all-ancestor without clear affinities, they may be collected in a subtree, being leftovers from optimizing all other tips with certain affinities and higher distance to the all-ancestor.


Fig. 5 Short-branch culling. Let's assume liverworts are the sister clade of higher land plants (an alternative with near-unambiguous support from cox1). The signal for this in mitochondrial data is weak (short root). On the other hand, there is a high risk for ingroup-outgroup long-branch attraction (LBA) leading eventually to an artificial Septaphyta clade. Because of (inevitable) LBA, even though the false branch is very short, its support can be high (unambiguous when using Bayesian inference).

By compiling the support for all alternatives, we can assess where the support is additive or subtractive. We do this using my re-analysis not Sousa et al.'s Bayesian analysis because:
  1. BS support is more sensitive to internal signal conflict than Bayesian PP,
  2. to extract this information, we need the tree samples used to establish the branch support.
When doing this, we find that the split defining the Septaphyta clade is not only missing from the nucleotide genes trees but also rarely found in the BS pseudoreplicate samples. Only for seven gene regions (atp4, atp8, nad2, rpl16, rps2, rps3, rps13) do we find BS ≥ 25; the highest support comes from rps3 (BS = 65; however, the split is not found in the corresponding Bayesian MRC of Sousa et al.).

On the other hand, the main alternatives find much higher and more consistent support, as shown here.

Fig. 6 Competing support for (purple) and against a Septaphyta clade (greens and yellows). Placing the hornworts as sister to all other land plants (pink) is compatible with the hypothesis of a Septaphyta clade as well as the competing alternative of placing the liverworts as sister to higher land plants; note the high support from cox1 gene for an according tree. *, for these genes no hornwort data were included/have been available.

Short-branch culling, a special form of ingroup-outgroup LBA

Now, my BS analyses were deliberately naive, because they did not apply any data partitioning. However, both liverworts and mosses have short-branches while the outgroup, the green algae, are extremely long-branched. If substitution saturation is an issue for misplacing either liverworts or mosses as sisters to all other land plants, then there should also be ingroup-outgroup LBA. A false split of liverwort + outgroup versus the rest, or moss + outgroup versus the rest, has a lower chance to be supported than would a false hornwort + outgroup versus the rest split. The latter directly opens the door for a Septaphyta clade (see Fig. 5).

Let's have a look at the trees of the four genes supporting the Septaphyta split, as the best alternative. ("AA tree/PP" is the amino acid tree provided by Sousa et al.; BS support refers to my unpartitioned ML analyses)
  • atp8 — The AA tree is a star tree (comb), strongly distorted by LBA: a Coleochaetales + seed plants | Zygnematales + all other land plants splits has a PP = 1; the short- and long-branched lycophytes are not resolved as sisters.
  • rpl16 — Also here, the AA tree is star-like regarding deep relationships: (i) green algae (unresolved), PP = 1; (ii) liverworts, very long root, little internal resolution PP = 1; (iii) mosses (unresolved), root half as long as for liverworts, PP = 1; (iv) higher land plants, short root, PP = 0.88.
  • rps3 — No ingroup-outgroup LBA, shortest-branched ingroup, liverworts, resolved as sister to mosses + rest (PP = 0.77); thus, AA tree, not affected by saturation issues, rejects the Septaphyta (PP < 0.23).
  • rps13 — Again, the AA tree is star-like, with five tips: (i) green algae (PP = 1); (ii) long-rooted hornworts (PP =1); (iii) liverworts, relatively short root (PP =1); mosses, longer root (PP = 1); (v) higher land plants, shortest root (PP = 0.89).
The Septaphyta root is either extremely short or non-existent, as we would expect for a false clade, because there are no character splits in the matrix that support the taxon split.

Fig. 7 Sousa et al.'s amino acid Bayesian MRC trees (top row) compared to codon-naive nucleotide ML trees (bottom row) producing highest BS support for a Septaphyta clade. Note that in two cases, rpl16 and rps13, the 'best-known' ML tree shows a competing split with much lower support.

Typically, since we are looking at a deep split, we would expect that support increases when shifting from (codon-naive) nucleotide to amino acid analysis, because we eliminate terminal noise. However, we observe the opposite (Bayesian PP more easily converges to unambiguous support than BS values). The difference between our codon-naive nucleotide ML and Sousa et al.'s amino acid MRC trees tells us that it is mostly information from the 3rd codon position that triggers a Septaphyta versus the rest split for these four genes — ie. potentially synonymous substitutions that Sousa et al. filtered against.

Where does the high support comes from for the Septaphyta clade in their combined tree? That tree is based on a matrix, that should have a signal in-between our codon-naive nucleotide and their amino acid analysis.

A five-taxon problem with a glitch

Sousa et al.'s study is exemplary, in that it provides a careful, and well documented, analysis of the combined data. If you want to infer a potentially good tree, this is one way to do it.

However, their Septaphyta clade is most likely a branching artifact. It still combines data that, genuinely, provides not only diffuse but conflicting information about how the main lineages of land plants diverged from each other (Fig. 6). No analysis, no matter how sophisticated and well-crafted, can compensate for the deficits of the underlying data. By filtering out "noise", one also filters out actual conflicting signal. In this case, this is about how liverworts, mosses, and hornworts stand in relation to the extremely long-branched and divergent outgroup, the green algae, and their increasingly evolved siblings, the higher land plants (lycophytes, ferns, and seed plants). It is another example of what I pointed out in last week's post: Big Data invites big (ie. well supported) errors.

It is important to realize that, although we use many more OTUs, we are still looking at a five-taxon problem. When our data supports one split (or prefers it, being biased or not), there are only three more alternatives to select from.

Ingroup-outgroup LBA draws the hornworts, as the genetically most distinct (longest-rooted) lineage of the "bryophytes", away from liverworts and the lycophyte Huperzia, which connects the much more diverged higher land plants to the bryophytes. This leaves three alternatives:
  1. Liverworts are the sister of higher land plants. Their mitochondria show some affinity, but only to the lycophytes, mostly the low-divergent and better sampled Huperzia; and often together with the hornworts, ie. a split incompatible with the hornwort-green algae versus the rest split.
  2. Mosses are the sister of higher land plants, but their mitochondria show very little affinity to any of them (including Huperzia). In fact, they seem to have the most primitive of all land plant mitochondria.
  3. Septaphyta are monophyletic, as the trade-off with the least conflict. Being (much) less diverged than the higher seed plants, they are genetically closer, and ± equally close, to the hornworts and the least-evolved higher land plant, the lycophyte Huperzia.
Sousa et al.'s codon-degenerate approach enforced ingroup-outgroup LBA between the hornworts (the worst-sampled ingroup) and the green algae, while decreasing the absolute distance between liverworts and mosses, and increasing their distance to the higher land plants. That is, Alternative 3 outcompetes Alternative 1. Alternative 2 has no support in the data.

Are the mosses sister to all land plants?

Probably not. Just because the Septaphyta clade is an artifact, it doesn't mean the Septaphyta cannot be monophyletic — it just means the mitochondrial genes don't provide any clear signal to support or reject such a hypothesis, or any other alternative. The same applies to the mosses as the first diverging lineage; their position in earlier trees is likely also to be an artifact — not a branching, but a data artifact. If their mitochondrial genomes are still very similar to that of the common ancestor of all land plants, then they should be placed like an ancestor in the tree — as a short-branched sister to all of their "offspring", the remaining land plant mitochondria.

Eight of the nine genes that support a moss + outgroup versus the rest split, fail to resolve a moss clade. This is a clear indication that the moss mitochondria are simply primitive (at all gene positions that matter). What divides them from most (or all) other land plants are symplesiomorphies — shared but ancestral sequence patterns. The only gene that prefers both splits at once, mosses as sister to all other lands plants as well as a moss clade, is nad4 (BS = 67 and 62, respectively); but only when using nucleotides.

Fig. 8 A small but important difference: the codon-naive ML nucleotide (nt) tree (left) shows a moss clade as sister to all other land plants. The Bayesian amino acid (aa) MRC tree for the same gene shows a wrong split (purple internode) between green algae + ferns + angiosperms (long-branch, prominent roots) and bryophytes + lycophytes (mostly short-branched, short roots). By translating nucleotides into amino acids one may eliminate genuine discriminative signal encoded in synonymous substitutions, while in other, faster evolving parts of the tree, the same site/gene is oversaturated/biased. The poorly supported sister relationship of Roya and Gonatozygon within the green algae in the nt ML tree is an artifact, correctly resolved by the aa tree based on the same gene.

The shift from nucleotide data (ML / BS) to amino acid data (Bayesian MRC) triggers ingroup-outgroup LBA between green algae and ferns + seed plants (PP = 0.53; 'short-branch culling' of bryophytes and lycophyte Huperzia), and results in a branching artifact — the monophyly of higher land plants is well established, and hence they should form a clade.

By contrast, the genes providing strong support for a moss clade (such as atp1, atp8, ccmB, cob, cox1, cox3, nad2, nad5, rpl6, rpl16, rps3, rps13, and rps14) fail to resolve any deep relationships at all, or prefer different alternatives (including the Septaphyta hypothesis: atp8, rps3, rps13). The combined tree's solution is therefore a least-conflicting one, again — a moss clade (based on a consistent signal in the majority of genes: 13 with BS ≥ 90; in total 24 with BS ≥ 58) as sister to the rest of the land plants (based on a signal found in other genes not reflecting the monophyly of mosses). This solution adds to the phenomenon that moss mitochondria are generally primitive (ie. show a variant basically ancestral to all other land plants), and doesn't conflict with a wide range of otherwise conflicting splits strongly supported by individual genes (in contrast to the Septaphyta clade, see Fig. 6).

Conclusion

Having spent some time with the data and gene trees, I have little hope that mitochondrial data can be used to resolve the deep relationships between land plants. Each tweaking may result in something different, and the support-after-tweaking will be inflated.

Nevertheless, it will be worthwhile to close the data gaps, especially for the hornworts. This may not solve the 5-taxon problem,* but may give unique insights in how the mitochondrial genome evolved and sorted during the initial radiation of land plants.

Notably, the mitochondriomes of land plants can differ in the arrangement of their genes; which means that they recombined with or within the nucleome (or even plastome). While in some plants the mitochondriome is passed on via both parents (like in Ginkgo or Cycas), in others it is only the mother (most, maybe all, angiosperms). Plants may have colonized land more than once, and expanded quickly, so that lineage crossing and also lineage sorting may be an issue — marine species can be cosmopolitan and genetically heterogeneous (cryptic speciation). Thus, some mitochondrial genes may tell different stories from others. Instead of trying to solve which of the alternatives is correct (which is what most phylogenetic literature revolves around), we should find out which gene or part of the genome agrees with which alternative, as they may be all true.

The question to address with mitochondrial data cannot be whether mosses, liverworts or hornworts are the first diverging branch of extant land plants, but should be why moss, liverwort and hornwort mitochondriomes show different stages of evolution, as exemplified by the nad4 trees in Fig. 8.

Data availability

An archive including the support consensus networks (in Splits-NEXUS format) and inferred gene ML trees (plain NEWICK), as well as the comprehensive split support table (XLSX format), has been uploaded to figshare.


* It may help to have an in-depth analysis of a more focused taxon set with no data gaps that minimizes the risk of LBA. This starts with a better selection of taxa representing the higher land plants:
  • Oryza (the rice) is a domesticated, much cultivated, and thus extremely evolved and polyploid monocot. If there is any deep signal embedded in the mitochondria of seed plants, the mitochondrion of rice is probably the last place to look for it.
  • When trying to resolve the deepest land relationships, including a Gnetidae like Welwitschia (a genus that is an evolutionary oddball to start with), makes equally little sense — like any of the three surviving genera of this unique gymnosperm lineage, it is genetically the outer-most tip of an iceberg. Each mutation in its genome is the product of an unknown number of divergences in the past.
  • If any seed plant should be included at all, would be more than sufficient to have: Liriodendron, a magnoliid, and thus a member of the least-diverged angiosperm lineage, plus Cycas, as a representative of an ancient, slow-evolving gymnosperm lineage. These are much more recent additions to the plant Tree of Life.
  • Being a tip of an iceberg applies even more to Isoetum. It is strikingly similar only to the other lycophyte, but it has more data gaps and is much more diverged, and thus can invite branching artifacts. When one wants to dig deep, the much more primitive Huperzia is obviously the better representative.
  • Last, the green algae are the only possible outgroups for inference, but they are poor for this – apparently, their mitochondria have evolved much farther from the common ancestor than those of the land plants. Rather than inferring trees including them, one should infer trees without them, and then optimize their position within trees that will then potentially be unbiased by outgroup-LBA — eg. using the evolutionary placement algorithm, to test the land plant root. An interesting experiment could also be to infer the sequence of the common ancestor(s) of modern-day green algae (lacking a time machine to sample it), and use them instead. The new RAxML-NG, for example, allows for ancestral state reconstruction of nucleotides.
In addition, standard 4-base substitution models are not the best choice when analyzing matrices with a high proportion of ambiguous base calls, like Sousa et al.'s codon-degenerate matrix (note that Sousa et al. already applied models that compensate for substitutional bias). This is especially so, given the importance of synonymous mutations to resolve relationships in the slow-evolving lineages, and slow evolving genes. One could try to use ambiguity-aware substitution models instead. The newest releases of RAxML-NG (Kozlov et al. 2019, Bioinformatics 35: 4453–4455) include models for "phased" and heterozygous data — ie. models that can make use of ambiguity codes as additional information during tree inference (see also Potts et al. 2014, Syst. Biol. 63:1–16).

Monday, May 18, 2020

Supernetworks and gene tree incongruence


One of the most interesting side effects of using Big Data in phylogenetics has been the realization that individual gene trees may be wrong as an estimation of the genome phylogeny. In the past, the easy "solution" was just to add more and more gene data until any topological ambiguity disappears, leaving us with a fully resolved, all-inclusive, tree.

However, even with increasing amounts of data, some relationships remain ambiguous. Adding data sometimes reveals primary conflict in the data, eg. because of a reticulate phylogenetic history. With modern-day software, we can quickly infer trees and compare them. Less straightforward is the interpretation of the observed conflict and what to do with it.

In our The Emperor has no clothes blog mini-series [Pt 1 – the mighty matK, Pt 2 – a thicket of trees, Pt 3 – conflict or not], I discussed gene incongruence in the complete angiosperm plastome data, which some people have interpreted as evidence for inter-plastome reticulation (recombination), as well as discussing the role that a single gene may play when inferring a trees based on a concatenated, multi-gene data set.

A new analysis

In this new post, I will show what a supernetwork can tell us about gene conflict using the data from a recent (open access and open data) paper investigating deep relationships in (land) plants.
Sousa F, Civáň P, Brazão J, Foster PG, Cox CJ. 2020. The mitochondrial phylogeny of land plants shows support for Setaphyta under composition-heterogeneous substitution models. PeerJ 8:e8995.
This is what the authors state:
Majority-rule consensus trees resulting from the best-fitting Bayesian MCMC analyses of individual genes had low resolution in general, but liverworts were supported (>95% posterior probability (PP)) as the earliest-branching lineage in two genes (nad 3 and nad 5), whereas the mosses were supported as the earliest-branching lineage in one gene (ccm C). All other resolutions of the bryophyte lineages relative to the tracheophyte clade were not statistically supported, and the Setaphyta clade was not resolved in any gene tree.
The authors objective was to filter the data, leaving those genes and information that can provide a better tree — ie. a less ambiguous one, resolving the deep relationships in land plants. Filtering the additive weak signals in each gene, and countering the problem of codon bias, leads to the fully resolved, unambiguously supported concatenated tree shown below.

Sousa et al.'s fig. 2, a fully resolved (all branches have PP = 1) Bayesian tree inferred from the concatenated 36 gene amino acid data. The novelty is the unambiguous support and recognition of a Septaphyta clade composed of liverworts (turquois) and mosses (brown).

The zenodo link provides full access to the data used. It includes:
  • the single-gene nucleotide and translated amino acid matrices,
  • the single-gene Bayesian majority rule consensus trees (MRC)
  • a concatenated 36-gene nucleotide and amino acid matrix, plus one cleaned for substitution bias ("codon degenerate"), and the resulting ML trees.
For this post, my objective is to visualize how the genes' information differs using a somewhat under-used (and under-appreciated) method: the supernetwork.

Why use a Supernetwork

Typically, we might just display the Consensus network of the single-gene trees (eg. summarizing branch-lengths or using averaged branch-lengths), and then compare it to the "preferred" concatenated tree (above). But, the data at hand includes missing gene partitions: some gene trees have fewer leaves. Consensus networks need tree samples that all have the same set of tips, while Supernetworks, on the other hand, can handle trees with different tip sets.

Here is the Supernetwork for our data, using the z-closure algorithm and tree-size averages for edge lengths (Huson et al. 2004, IEEE/ACM Trans. Comput. Biol. Bioinform. 1: 151–158).

Supernetwork of the 36 mitochondrial gene trees. Edge bundles corresponding to branches in Sousa et al.'s fully resolved tree in blue, conflicting edge bundles in red. Gray, systematic groups not represented by according branches (taxon bipartitions) in any gene tree.

This Supernetwork is not based on the MRC provided, but gene-based ML trees. MRC trees are not strictly phylogenetic trees (Losing information in phylogenetic consensus; Why should we present a Bayesian phylogenetic analyses using networks): they can include, as in this case, polytomies originating from collapsing branches below a certain PP threshold. To distill and visualize the primary (raw) signal, I also did not partition the codons; treating the often saturated (in the case of mt DNA) third codon position as distinct data partition, would be obligatory in case we wanted to have the best-possible phylogenies.

Although the network is quite boxy (not tree-like), it does contain nearly all of the edges (branches; in blue) that make up Sousa et al.'s fully resolved, concatenated amino acid tree, with the exception of the Septaphyta edge (as noted by Sousa et al.) Although we used the suboptimal nucleotide matrices and none of our gene trees was fully congruent with the concatenated amino acid tree, they all included aspects of it (despite not filtering or correcting for codon bias).

When talking about gene incongruence, use a Supernetwork

Supernetworks (see also Whitfield et al. 2008, Syst. Biol. 57: 939–947) are much under-used graphs, ideal to visualize statements such as the one by Sousa et al. quoted above. They not only show the full extent of the gene tree incongruence but also to what degree it relates to short or long branches in the gene trees — this is something that, eg., cloudograms, fail to do. While a cloudogram is a summary of cladograms (sister relationships), a Supernetwork is a summary of phylograms, phylogenetic trees informing us about the amount of change. Keeping an eye on branch lengths helps a lot when interpreting branch support and discussing tree topologies, especially trees based on concatenated gene data (filtered or not).

Monday, January 13, 2020

Why we may want to map trait evolution on networks, pt. 2 – Topological ambiguity


In last week's Part 1, I gave an introduction to the problem of categorizing the polarity of morphological traits. How can we reconstruct which characters are primitive, or plesiomorphic according to Hennig, and which are derived, or apomorphic? This is something we need to do to reconstruct evolution, because most of the past is only preserved in the form of fossils, usually lacking any DNA. In this second part of the discussion, I'm going to take apart my own tree and show why we inevitably need networks, not trees.

There may be more than one tree

Even with more and more data at hand, some molecular phylogenies refuse to be unambiguous. Even worse, different, well-sampled molecular data sets may tell different stories — ie. there is more than one molecular tree to explain the diversity patterns. The ML tree used for the ML character mapping in Part 1 was pretty well supported, but not telling the entire truth.

For a start, there is no reason to assume that oaks are not monophyletic even though the data fail to resolve them as a clade (evolving something unique like the oaks twice would be a striking trick, even for gambling Mother Nature) — molecular trees may have misleading, sometimes just wrong, branches, even when they are highly supported.

In this case, one complication is that the oligogene dataset combines plastid and nuclear gene regions that not only differ in their information content but also infer different phylogenetic scenarios (and mask a lot of intra-generic and sub-generic incongruencies). This is illustrated in the following tanglegram.

Fig. 3 – A tanglegram, on the left the ML tree inferred from only the plastid gene regions (1406 DAP, alignment 15254 bp long), and on the right the corresponding nuclear data based tree (1691 DAP per only 4983 bp).

Even though the support along the backbone of the plastid tree is lowa (to non-existent), it well reflects the general diversification patterns in Fagaceae plastomes (see also the tree in Manos et al. 2008, Madroño 55:181–190; and Yan et al. 2019, BMC Evol. Biol. 19: 202, for an oak global picture). Plastid signatures show a strong geographic sorting (eg. New World vs. Old World), while the nuclear data provides most of the lineage-differentiating signal expressed in the combined tree (Part 1, Fig. 2).

Mapping along networks

How do we decide what is a real synapomorphy, a homoiology, or a good symplesiomorphy? Mapping the traits along all possible rooted trees is one option. Another option is to just map them along a consensus network of all trees, as shown next.

Fig. 4 – Map of the seven characters on the consensus network of the nuclear and plastid trees shown in Fig. 3. Blue – genus autapomorphies, dark green – synapomorphies/terminal homoiologies, light green – symplesiomorphies, orange – deep homoiologies, red – randomly distributed trait, pink – genus-restricted reversals.

According to the mapping, the newly described South American Castanopsis rothwellii, assigned to the modern (Souteast Asian) genus Castanopsis, is a stem Castanoideae / Fagaceae, while the "extinct" North American genus Castanopsoidea (then the "earliest megafossil evidence of Fagaceae": Crepet & Nixon 1989, Am. J. Bot. 76: 842–855) could be a stem / crown member of the Castanea-Castanopsis lineage. The difference to the ML trait mapping (Fig. 3 in Part 1) on the combined tree is that we get a better picture what is a lineage-specific trait set in Castanea-Castanopsis, because the interference of the monophyletic(!) oak grade is minimized.

Another possibility is to map the characters directly along a distance-based network, and then compare the latter with the molecular-based topological alternatives. This is quite puzzling in this case, because the morphology (Fig. 1 in Part 1) matches neither the nuclear tree nor the plastid tree (Figs. 2–4) — the traits scored for the fossils cover largely morphological Play-Doh of the Fagaceae.

Fig. 5 – Neighbor-nets based on mean morphological distances. Top graph – polymorphisms treated as ambiguities (standard approach), bottom graph – polymorphism treated as additional states (experimental approach). Text coloring as in Fig. 4, light blue – potential autapomorphy of the fossil American castaneoid lineage. Edge colors: green – edge representing a molecular clade/likley monophyletic group; orange – edge representing a paraphyletic group; red – edge rejected by molecular data; blue – edges supporting a distinct fossil American castaneoid lineage.

The likely primitive characters, irrespective of the evolutionary scenario we prefer, are those also found in the Eocene fossilsb. There are no derived traits/character suites pinning the fossils to Castanopsis. The fossils are a bit derived on their own terms (note their position in Fig. 5), and hence we can deduce that the fossils are either: (a) representing a relatively primitive extinct American sister lineage or (b) surviving, somewhat evolved members of the precursors of modern-day core Fagaceae. Note that the derived oaks evolved nearly 60 myrs ago, ie. 8 myrs before the oldest (Patagonian) Castanoideae fossil was deposited. The earliest (known) Fagaceae and castaneoid pollen are from 80+ Ma old Upper Cretaceous sediments in western North America (Grímsson et al. 2016, Acta Palaeobot. 56: 247–305; open access) and Japan (Takahashi et al. 2008, Intl. J. Plant Sci. 169:899–907), giving them plenty of time to migrate into North and then South America during the Paleocene-Eocene green house episode.

Fig. 6 – Earliest fossil record of Fagaceae and Castanoideae mapped on Scotese's Paleoglobes (© Scotese 2013, GoogleEarth layover files are available from here). Note that although there was no continuous land bridge, North and South America were already connected by a chain of large and high islands, providing a corridor for intercontinental dispersal of near- and extra-tropical plant lineages. A potential  crown-group Castanopsis (C. kaulii, cupule with associated seeds and pollen) has been recently recovered from the Baltic Amber (Sadowski et al. 2018 Am. J. Bot 105: 2025–2036).

Both of the mapping procedures described above are crude, in the sense that they ignore the molecular branch lengths, and use Ockham's Razor. But it strikes me as being not a bad start. They are better than just mapping along a single preferred molecular tree (as is done in many neontological papers; see Part 1) or along a morphology-based strict consensus cladogram (as is done in far too many paleontological papers; many palaeobotanical papers do neither the one nor the other: eg. Wilf et al., 2019, Science 364: eaaw5139). It's important to realize that if one taxon or subtree of our modern taxon set is characterized solely by the lack of shared derived traits or unstable expression of derived traits (like Castanopsis here, see position in both graphs in Fig. 5), ie. represents living fossils or little-evolved lineages, any ancient and primitive fossil, stem group, sister group or precursor, will be attracted by them in a total evidence or any other tree-based approach, especially when we rely on change-probability-naive parsimony as inference criterion. As we pointed out repeatedly: forming a clade in tree is neither a necessary nor a sufficient criterion for monophyly.

All gone, what to do when we have no molecular data?

Morphology alone, like genes on their own, will inevitably get some things wrong (compare Fig. 4 with Fig. 5). Without molecular data, one may have little reason to reject the monophyly of the Castaneoideae (when using more than the seven characters scored by Wilf et al. 2019; see eg. the cladogram in Crepet & Nixon 1989, fig. 1 based on an undocumented 25-character matrix). In the process, we would misinterpret overall similarity, due to shared primitive character suites and the lack of shared derived traits as evidence for an inclusive common originc.

What can we do if we have no or very few extant taxa, when we only have one set of data prone to circular reasoning? Then using networks is inevitable as well (see Fig. 5; and some examples provided in the reading list below). We need to explore in-depth the signal in our data matrix. Only extremely biased morphological matrices provide clear tree-like signals, comprehensive ones will have internal conflict and allow for inferring many, partly very different but more or less equally optimal trees.

Exploratory data analysis will not eliminate all possible errors — based only on the graph in Fig. 5, we would get the inter-generic phylogenetic relationships in Fagaceae partly wrong. However, this may lead to an informed decision as to which of the many equally probable evolutionary scenarios make more sense than others. It will help to reduce the alternatives, without eliminating those that are equally valid (which every tree does). If the time-coverage is good, exploring morphological differentiation over time can be an asset, too (see eg. Stacking neighbor-nets – a real-world example).

Data

The matrices used, networks etc. can be accessed via figshare.

Selection of related posts on The Genealogical World of Phylogenetic Networks

Clades, Cladograms, Cladistics, and why networks are inevitableillustrates why paleontologists should also be less tree-naive (see example in footnote c).
Has homoiology be neglected in phylogenetics? — why we should try to assess the phylogenetic quality of our traits.
Let distinguish between Hennig and Cladisticsas said in the title, the post provides reasons why we should distinguish between Hennig's concepts and clades in phylogenetic trees.
Ockham's Razor applied, but not used: can we do DNA-scaffolding with seven characters? — the original post dealing with Wilf et al.'s (2019) "phylogenetic analysis", which obviously was not scrutinized during review.
Please stop use cladograms!No matter whether you think evolution is tree-like or not, cladograms should be a matter of the past.
Should we try to infer trees on tree-unlikely matrices? —  using well-known (among paleobotanists) examples, I show why networks reveal much more than any tree when we deal with fossils.
More non-treelike data forced into trees: a glimpse into the dinosaursthe same but for a thunder lizard matrix.
Trivial data, but not so trivial graphsan inference experiment using very simple artificial binary matrices.


a The main reason for the lack of branch support is that individuals of different genera growing in the same area can share plastid haplotypes, while individuals of the same genus / infra-generic lineage, even species, can be quite different. [Note that the standard 4x4 ML nucleotide model treats polymorphisms as such, not as missing data.] Plus, the different lineages show different levels of plastid diversity (highest in Quercus subgenus Cerris, but low in subgenus Quercus, the North American castanoids and Lithocarpus outside Borneo, Castanea-Castanopsis appear to be in-between the extremes), and there is a tendency to preferably mutate sequence patterns within a lineage that otherwise differentiate between lineages (for instance, inversions that distinguish two genera, can be found as intra-lineage variation in the third genus or one of the oak sections).

b The striking similarity between the newly found South American and long-known slightly older North American fossils is likely the reason for not discussing the latter in the original paper or including them in the "DNA-scaffold" analysis. As is obvious from the graphs, the slightly younger North American fossil could easily be a slightly more derived of the same lineage than the South American fossil (Planchard et al. 2016 Paleont. Electr. 19.3.51A give a revised age of ≥ 49 Ma for the plant-bearing strata), and thus would have been at odds with the narrative of the authors (see also comment by Denk et al. 2019, Science 10.1126/science.aaz2189).

c As done by Wilf et al. (see also the argumentation in Wilf et al.'s response, Science 10.1126/science.aaz2297, to Denk et al.'s 2019 comment). The combination of circular reasoning, systematic bias, and (parsimony) tree-naivity is well expressed in Wilf et al.'s own words:
Fourth, Denk et al. erroneously contend that Castanopsis rothwellii, a fossil with so many diagnostic characters preserved that it could only be assigned to Castanopsis if “found alive” today (1), has plesiomorphic features and cannot be placed confidently in the extant genus [see Figs. 1–5 in this two-part post]. ... Denk et al.’s phylogenetic conclusions from their emended tree and matrix are misleading, in that any morphological matrix includes characters that are relevant only for the taxa included in the analysis. ... Because the fossils are castaneoid in all features, we did not include all Fagaceae in our original analysis (1) and likewise did not include all characters relevant to non-castaneoid fagaceous taxa. ... By adding just three relevant characters to the Denk et al. scaffold to accommodate the genera they added (Table 1), the fossil Castanopsis rothwellii is placed only with Castanopsis in the single [ie. the strict consensus of two equally parsimonious trees] most parsimonious tree (Fig. 1).
One of the three added traits ("expanded stigma") is exclusively shared by all five Castaneoideae genera, the second ("nut generally rounded in cross section") shared by all but one Castaneoideae and Quercus, and thus are symplesiomorphies of core Fagaceae: shared primitive traits that can be expected in a precursor of several or all modern genera or their less evolved extinct sister lineages. Or positively selected homoiologies, ie. evolved multiple times within the core Fagaceae. The third ("asymmetrical cupule") is an unstable convergence / deep parallelism and a trait of little phylogenetic value, since expressed as intra-generic (intraspecific?) variation in two distantly related genera: the monotypic Formanodendron, a trigonobalanoid, and Castanopsis. These are two genera that share only a very distant (and exclusive fide Hennig) common origin (see Part 1) but inhabit overlapping climate envelopes and ecological niches in modern-day East Asia.

Despite adding three hand-picked characters (from a set of at least 25 at hand, Crepet & Nixon 1989) and accepting a phylogeny closer to the reality, the Castanopsis "clade" in the new "scaffold tree" including the Patagonian fossil remains unsupported by any exclusive or even shared and stable derived trait/set of traits (as in the original study, Wilf et al. refrain from establishing any sort of node or branch support, or test of alternative placements).

Moreover, it is safe to assume that when one adds the extinct genus Castanopsoidea to the scaffold (Wilf et al. deliberately chose not to do so), it would compete with Castanopsis rothwellii for the placement next to the modern-day Castanopsis. According to Crepet & Nixon 1989, fig. 1, one possible placement of Castanopsoidea is a sister to "Castanopsis (1)". This is not necessarily because they share a direct common origin but because these fossils also lack uniquely derived characters or a clearly derived character suite defining all Fagaceae genera except for Castanopsis (which in Crepet & Nixon's morpho-tree, is paraphyletic to Lithocarpus, which, back then, included the potential oak sister genus Notholithocarpus — literally: the 'false Lithocarpus'). Personally, for the same reasons as outlined and applied in Bomfleur et al. 2017, PeerJ 5: e3433 (and like Denk et al. 2019), I would have no problem calling all these fossils Castanopsis by defining the genus as explicitly paraphyletic, which could include the modern-day species of Castanopsis (which are probably monophyletic) and Castanopsis-like fossils that may be more or less related to them and/or other core Fagaceae: the precursors and extinct but similar, underived sister lineages.

Monday, November 4, 2019

Why the emperor has no clothes on – a thicket of trees


A critical question in phylogenetics, and this applies to both the detection and inference of reticulation, is: How much trust do we put in the inferred tree? A phylogenetic tree is just the simplest of all possible phylogenetic networks. Let's assume that there was some phylogenetic reticulation in the past (lineage mixing and crossing), then, in the best-case scenario, our inferred tree shows one of the intertwining pathways but misses the tangles, the crossroads.

An example of simple reticulate evolution: pink is the product of very recent lineage crossing between an early diverged (and otherwise lost) member of the blue lineage and the more recently, hence genetically more coherent, red lineage. Bold lines show the tree we would likely infer in such a situation.

In the worst case, summarizing data with substantially different signals will give us branching artifacts such as:
  • terminal branches that are too long,
  • too long internal branches with conspicuously low support (ie. BS << 100, PP < 1.0),
  • artificial branches representing the least-conflicting solution for the conflicting data,
  • low branch support in general.
See eg. the bear data we used as a real-world example for our Intertwining trees and networks paper (Schliep et al. 2017, open access).

Three possible trees for bears, (a), Y-chromosome, paternal, and (c), nuclear-encoded autosomal introns, biparentally inherited, are congruent but disagree with the maternal genealogy (b), based on the mitochondrial genes. When fusing all three data sets, we get a (low) supported sister relationship for Sloth and Sun bears (red clade), not supported by any of the three fused data set – a branching artifact.

Topological incongruence between gene trees and parental genealogies (as above) is commonly taken as evidence for reticulation. If one gene provides high support for taxon A as sister to B, and another gene has high support for B as sister to C, then B is likely the product of reticulation (eg. hybridization)

One simple possibility to put together a phylogenetic network is to summarize all of the trees in the form of a Consensus network, as shown next. (Technically this is a splits graph, it becomes a phylogenetic network as soon as we determine a root, which, here, would be at the edge leading to the Giant Panda.)

A strict Consensus network of the paternal, biparental, and maternal bear genealogies.
The numbers show the non-parametric bootstrap support for each (competing) split.

In this case, low support for a branch in a combined tree (the values on top) can result from strong conflict. For instance, the brownish splits, which are poorly supported using the combined data (BS = 21, 29), receive near unambiguous support from the mitochondrial genes, but are largely or entirely rejected by the Y-chromosome and nc-intron data. In the combined tree, this deep conflict is resolved by introducing the artificial red clade, with similarly low support: the signal in the data is ambiguous and they support splits between equally possible alternatives.

We know lineage crossing took place in bears (the mitochondrial and Y-chromosome tree are very much in conflict). However, does the above mean that earliest bear-ish creatures hybridized, too? Note that the conflict is associated with a short-branched part of the graph, where apparently little evolution happened. Fast ancient radiations usually come with incomplete lineage sorting and diffuse signals. The only data set producing longer roots, but with notably lower support, are the biparentally inherited introns.

We are closing in our own tail and have to ask again: Is this low support in the autosomal intron tree due to internal conflict, (sets of) introns preferring different topologies, supporting an ancient mixing hypothesis, or just reflecting lack of resolution? Check out the original paper by Kutschera et al. (2014, Mol. Biol. Evol. 31: 2004–2017), and make up your own mind.

On to the angiosperms

In my last post, I exemplified what Walker et al. (PeerJ, 2019) found in their angiosperm study: when we look at a plastome tree we are not looking at a summary of all gene trees but instead at a topology forced by very few of the genes in the chloroplast genome, such as the matK. We also have seen that one misplaced sequence (outgroup Podocarpus-matK) doesn't affect at all the combined analysis — it didn't even reduce the ingroup - outgroup split support. Also, I noted that the low-supported part of the combined tree goes hand in hand with lack of decisive signal from the matK.

It's time to take a look at what the other genes in this example data set come up with.

The eight gene trees. Terminal subtrees collapsed. Scales fit to size, scale bar = 0.1 expected substitutions per site. Upper left, matK tree which is very similar to the combined tree using all gene regions (cp = chloroplast, mt = mitochondrial, nc = nuclear genes). Note the low performance of the mt genes.

One thing is obvious: for most genes (except the nuclear-encoded rRNA genes) including the outgroup taxa adds little ingroup information of use — they are just too distant to any of the ingroup taxa. Outgroup rooting is tricky for angiosperms. Outgroup taxa will always be attracted to the ingroup taxon that is the least similar to any other part of the ingroup: Amborella in this case.

Generally, all of the ANA-grade water plants are genetically distinct and topologically isolated; any outgroup-inferred root must be placed in this part of the tree (all other living seed plants are very distant relatives of angiosperms looking back at, at least, ~250 million years of independent evolution, see eg. Age of Angiosperms... and What is an angiosperm pt. 2). The relatively conserved plastid rbcL and mitochondrial matR prefer an Amborella-Nympheales clade as sister to all other angiosperms, while the more divergent atpB, plastid, nad5, mitochondrial, and 25S, nuclear, prefer the Amborella-root — this is a direct indication for ingroup-outgroup long-branch attraction. Any other placement of the outgroup subtree within the ingroup would necessarily decrease the likelihood of the tree (but note the position of the root in the 18S tree, lower-left the tree based on the most-conserved, evolution-constrained gene in our sample; see also All solved a decade ago..., fig. 4A).

We can look at these trees with the strict consensus network, using uninformed edge lengths— that is, the network counterpart to the strict consensus cladograms still common in plant phylogenetic literature.


This is a nice piece of computer-art, but is scientifically quite useless (the boxiness and general graph structure is, however, reminiscent of strict consensus networks of most-parsimonious tree samples inferred for extinct animals, one example, and plants).

We can add some discriminatory information by counting how often each split occurs in the set of gene trees.

Same set of tree, different way of summarizing it. Note how the main clades emerge: one or two genes may have misplaced the one or other OTU but the others get it right.

Alternatively, we can average the actual tree branch lengths to inform the edge length of the consensus network.

The light green, sand-colored, light brown and dark olive (clockwise) splits are likely branching artifacts. The light blue split is the one that supports the ANA-grade when the (combined) tree is rooted with the very distant outgroups.

A pretty little thicket of trees. Some agreement is found towards the leaves, but even here we have conflict among the gene trees. In some trees, there are long branches grouping non-related OTUs, obvious tree inference artifacts. The general rule is that the deeper we go (ie. the farther back in time), the messier it gets. Adding to this is that, irrespective of which gene is used, some OTUs are much closer to the hypothetical common ancestor (of Mesangiosperms, ie. all but ANA grade) than others – in the eudicots, the least-evolved taxa are Platanus (very old tree genus) and Euptelea (the basalmost Ranunculales); in the Magnoliales, the only angiosperm clade that lacks synapomorphies, it's Magnolia and Liriodendron (again, very old and primitive tree genera). Darwin's Abominable Mystery, the sudden appearance and quick dominance of angiosperms, resulted in an abominable chaos of gene trees and signals. How can they possibly converge to a single tree with amply high support along most branches?

The combined tree from the first post.
When compared to the bears, the answer may well be: because there has been very little to no reticulation between these lineages. Our thicket may be not a forest of trees but just a poorly trimmed, wildly overgrown bush. They genes share the same history, but when being analyzed one-by-one, each of their trees get some aspects right, and some others (severely) wrong. Misplacing one OTU (e.g. the light green, dark olive, sand-colored and dark yellow splits in the averaged Consensus network) may have further topological effects; it didn't matter for the matK gene, because we misplaced only one very alien OTU in a data set that otherwise is hardly affected by adding or removing OTUs.

I argue here that, if there had been substantial reticulation messing up the signal of contemporary lineages and reflecting decoupled histories (like in the case of bears), we would expect at least some (artificial) branching patterns with low support in the combined tree, as well. This would also be the case looking at the gene-tree consensus networks, not only in the deepest parts but also closer to the leaves.

We will be explore this alternative hypothesis in the next (and final) post of this mini-series.