Showing posts with label Gene flow. Show all posts

Monday, April 1, 2019

The Tree of Life (April 1)


The so-called Tree of Life is actually an anastomosing plexus rather than a divaricating tree, due to extensive interconnections between the cell and genome lineages during early single-cell evolution. These connections may have been caused by the process known as horizontal gene transfer.

Furthermore, the alleged Last Universal Common Ancestor may not have been a single coherent group, but may have been a mixture of quite different genotypes. After all, this supposed ancestor does not represent the origin of life, but was itself the end-product of an extensive prior evolutionary history.

These two basic points are illustrated in the following figure.


Happy April 1. For previous posts, see:

Tuesday, June 20, 2017

Cichlids, species and trees

Lake Malawi, in south-eastern Africa, is famous for its large diversity of cichlid fishes. Indeed, it sometimes seems to have more biologists studying these fish than there are actual fish in the lake, even though there are allegedly hundreds of cichlid fish species in that lake. In this sense, it is somewhat similar to Lake Baikal, in southern Siberia, home to the sole species of freshwater seals.

The cichlid biologists are interested in describing the extensive fish diversity, pondering its origin, and thus its contribution to the study of speciation. After all, we are talking about what is usually claimed to be "the most extensive recent vertebrate adaptive radiation". So, we are talking here as much about population genetics as we are about ichthyology.


Inevitably, the genome biologists have been spotted in the vicinity of the lake; and we now have a preliminary report from them:
Milan Malinsky, Hannes Svardal, Alexandra M. Tyers, Eric A. Miska, Martin J. Genner, George F. Turner, Richard Durbin (2017) Whole genome sequences of Malawi cichlids reveal multiple radiations interconnected by gene flow. BioRxiv 143859.
These authors summarize the situation like this:
We characterize [the] genomic diversity by sequencing 134 individuals covering 73 species across all major lineages. Average sequence divergence between species pairs is only 0.1-0.25%. These divergence values overlap diversity within species, with 82% of heterozygosity shared between species. Phylogenetic analyses suggest that diversification initially proceeded by serial branching from a generalist Astatotilapia-like ancestor. However, no single species tree adequately represents all species relationships, with evidence for substantial gene flow at multiple times.
The last sentence seems to be somewhat disingenuous. How could a single tree be expected to describe this scale of biodiversity? Any rapid radiation of diversity is unlikely to be completely tree-like. The increase in diversity can be modeled as a tree, sure, but it is very unlikely that there will be instant separation of the taxa, and so the tree model will be ignoring a large part of the evolutionary action. There will, for example, be ongoing introgression between the diverging taxa, as well as hybridization due to incomplete breeding barriers. These avenues for gene flow can best be modeled as a network, not a tree.

The issue here is that the authors write the paper solely from the perspective of an expected phylogenetic tree, and then feel compelled to explain why they do  not produce such a tree. Indeed, the authors present their paper as a study of "violations of the species tree concept".

For data analysis, they proceed as follows:
To obtain a first estimate of between-species relationships we divided the genome into 2543 non-overlapping windows, each comprising 8000 SNPs (average size: 274kb), and constructed a Maximum Likelihood (ML) phylogeny separately for each window, obtaining trees with 2542 different topologies.
So, only two sequence blocks produced the same tree, presumably by random chance. An example "tree" for 12 OTUs is shown in the diagram. It superimposes a possible mitochondrial trees on a summary of the "genome tree".

Example phylogeny from Malinsky (2012)

The authors continue:
The fact that we are using over 25 million variable sites suggests these differences are not due to sampling noise, but reflect conflicting biological signals in the data. For example, gene flow after the initial separation of species can distort the overall phylogeny and lead to intermediate placement of admixed taxa in the tree topology.
Note that gene flow is seen to "distort" the phylogeny rather than being an integral part of it. In this case, "phylogeny" apparently refers solely to the diversification part evolutionary history, rather than to the whole history.

The ultimate questions from this paper are: "what is a species concept?", and "what is a species tree?". The authors write a lot about species and trees, and yet their data provide very clear evidence that both "species" and "tree" are very restrictive concepts for studying the cichlids of Lake Malawi.

Coincidentally, another recent paper tackles the same problems:
Britta S. Meyer, Michael Matschiner, Walter Salzburger (2017) Disentangling incomplete lineage sorting and introgression to refine species-tree estimates for Lake Tanganyika cichlid fishes. Systematic Biology 66: 531-550.
The authors describe their work, on the same fish group but in a lake further north-west, as follows:
Because of the rapid lineage formation in these groups, and occasional gene flow between the participating species, it is often difficult to reconstruct the phylogenetic history of species that underwent an adaptive radiation. In this study, we present a novel approach for species-tree estimation in rapidly diversifying lineages, where introgression is known to occur, and apply it to a multimarker data set containing up to 16 specimens per species for a set of 45 species of East African cichlid fishes (522 individuals in total), with a main focus on the cichlid species flock of Lake Tanganyika. We first identified, using age distributions of most recent common ancestors in individual gene trees, those lineages in our data set that show strong signatures of past introgression ... We then applied the multispecies coalescent model to estimate the species tree of Lake Tanganyika cichlids, but excluded the lineages involved in these introgression events, as the multispecies coalescent model does not incorporate introgression. This resulted in a robust species tree.
Once again, phylogeny = species tree.

Tuesday, June 13, 2017

Bayesian inference of phylogenetic networks


Over the years, a number of methods have been explored for constructing evolutionary networks, starting with parsimony criteria for optimization, and moving on to likelihood-based inference. However, the development of Bayesian methods has been somewhat delayed by the computational complexities involved.

Network from Radice (2012)

The earliest work on this topic seems to be the thesis of:
Rosalba Radice (2011) A Bayesian Approach to Phylogenetic Networks. PhD thesis, University of Bath, UK.
Apparently, the only part of this work to be published has been:
Rosalba Radice (2012) A Bayesian approach to modelling reticulation events with application to the ribosomal protein gene rps11 of flowering plants. Australian & New Zealand Journal of Statistics 54: 401-426.
The method described requires the prior specification of the species tree (phylogeny), and the position and number of the reticulation events. The algorithm was implemented in the R language.

More recently, methods have been developed that infer phylogenies by using (i) incomplete lineage sorting (ILS) to model gene-tree incongruence arising from vertical inheritance, and (ii) introgression / hybridization to model gene-tree incongruence attributable to horizontal gene flow. ILS has been addressed using the multispecies coalescent.

The first of these publications was:
Dingqiao Wen, Yun Yu, Luay Nakhleh (2016) Bayesian inference of reticulate phylogenies under the multispecies network coalescent. PLoS Genetics 12(5): e1006006. [Correction: 2017 PLoS Genetics 13(2): e1006598]
The method requires the set of gene trees as input, along with the number of reticulations. The algorithm was implemented in the PhyloNet package.

In the past few months, two manuscripts have appeared that try to co-estimate the gene trees and the species network, using the original sequence data (assumed to be without recombination) as input:
Dingqiao Wen, Luay Nakhleh (2017) Co-estimating reticulate phylogenies and gene trees from multi-locus sequence data. bioRxiv 095539. [v.2; v.1: 2016]
Chi Zhang, Huw A Ogilvie, Alexei J Drummond, Tanja Stadler (2017) Bayesian inference of species networks from multilocus sequence data. bioRxiv 124982.
The algorithm for the first method has been implemented in the PhyloNet package, while the second has been implemented in the Beast2 package.

Finally, another manuscript describes a method utilizing data based on single nucleotide polymorphisms (SNPs) and/or amplified fragment length polymorphisms (AFLPs), which thus sidesteps the assumption of no recombination:
Jiafan Zhu, Dingqiao Wen, Yun Yu, Heidi Meudt, Luay Nakhleh (2017) Bayesian inference of phylogenetic networks from bi-allelic genetic markers. bioRxiv 143545.
This method has also been implemented in PhyloNet.

Due to the computational complexity of likelihood inference, all of these methods are currently severely restricted in the number of OTUs that can be analyzed, irrespective of whether these involve multiple samples from the same species or not. In this sense, parsimony-based inference or approximate likelihood methods are still useful for constructing evolutionary networks of any size. However, progress is clearly being made to alleviate the computational restrictions.

Tuesday, June 6, 2017

Bears, genomes and gene flow


It has traditionally been assumed that speciation occurs when gene flow between populations ceases. However, nothing in biology ever remains simple — the more we study any biological phenomenon the more complex it becomes. So, speciation with gene flow is becoming a more commonly discussed topic. This is especially so with the advent of genome sequencing, which allows us to study the extent of gene flow in the past, rather than solely in the present.

A case in point is the recent paper by:
Vikas Kumar, Fritjof Lammers, Tobias Bidon, Markus Pfenninger, Lydia Kolter, Maria A. Nilsson and Axel Janke (2017) The evolutionary history of bears is characterized by gene flow across species. Nature Scientific Reports 7: 46487.
This paper considers the evolutionary relationships among seven species of bears, with multiple genome samples from four of those species. The coalescent species tree (based on 18,621 genome fragments > 25 kb), which accounts for incomplete lineage sorting (ILS), is well supported, as shown here.


However, numerous individual genome-fragment trees support alternative topologies. For example, 38% of the trees support a topology where the Asiatic black bear is the sister to the American black - Brown - Polar bear clade. This suggests that there is more than simply ILS that creates the conflicting genome trees.

The authors applied several different data analyses to investigate the possibility of gene flow among the species. They found considerable evidence for gene flow, as shown in the network (the arrow colors represent different analyses).


Indeed, each of the six in-group species could conceivably be connected by gene flow to each of the other five species. The network shows evidence that the Brown, Asiatic and Sloth bears might have all five connections, while the Polar and Sun bears have four, and the American bear has three.

As the authors note, some of this potential gene flow cannot have occurred directly between species, because they live in different habitats. Instead, it may be remnants of ancestral gene flow, or gene flow through a vector species. In particular, the strongest signal of gene flow connects the Asiatic black bear with the ancestor of the American black - Brown - Polar bear clade.

Ancestral gene flow is of considerable importance when studying evolution. Charles Darwin was perhaps the first to note (in his notebooks) that we should always treat ancestors as species not as taxonomic groups, no matter how big the groups of descendants now are. Whole kingdoms and phyla were once a single species, if the contemporary groups are monophyletic

Monday, February 23, 2015

Darwin's Finches, genomics and phylogenetic networks


As a means of motivating his interest in speciation, in The Origin of Species Charles Darwin highlighted the diversity of morphological forms among the finches of the Galápagos Islands, in the south-eastern Pacific Ocean, which he visited while circumnavigating the world in The Beagle. He considered this to be a prime example of biodiversity related to adaptation and natural selection, what we would now call an adaptive radiation.

Recently, the following paper, which provides a genomic-scale study of these birds, has attracted considerable attention:
Lamichhaney S, Berglund J, Almén MS, Maqbool K, Grabherr M, Martinez-Barrio A, Promerová M, Rubin CJ, Wang C, Zamani N, Grant BR, Grant PR, Webster MT, Andersson L (205) Evolution of Darwin's finches and their beaks revealed by genome sequencing. Nature 58: 371-375.
The authors note:
Darwin's finches are a classic example of a young adaptive radiation. They have diversified in beak sizes and shapes, feeding habits and diets in adapting to different food resources. The radiation is entirely intact, unlike most other radiations, none of the species having become extinct as a result of human activities.
Here we report results from whole genome re-sequencing of 120 individuals representing all Darwin's finch species and two closely related tanagers. For some species we collected samples from multiple islands. We comprehensively analyse patterns of intra- and inter-specific genome diversity and phylogenetic relationships among species. We find widespread evidence of inter-specific gene flow that may have enhanced evolutionary diversification throughout phylogeny, and report the discovery of a locus with a major effect on beak shape.
Sadly, the authors try to study the intra- and inter-specific variation principally using phylogenetic trees. They do this in spite of noting that:
Extensive sharing of genetic variation among populations was evident, particularly among ground and tree finches, with almost no fixed differences between species in each group.
Clearly, this situation requires a phylogenetic network for adequate study, as a network can always display at least as much phylogenetic information as a tree, and usually considerably more. The authors do recognize this:
A network constructed from autosomal genome sequences indicates conflicting signals in the internal branches of ground and tree finches that may reflect incomplete lineage sorting and/or gene flow ... We used PLINK to calculate genetic distance (on the basis of proportion of alleles identical by state) for all pairs of individuals separately for autosomes and the Z chromosome. We used the neighbour-net method of SplitsTree4 to compute the phylogenetic network from genetic distances.
However, this network is tucked away as Fig. 3 in the appendices. It is shown here in the first figure. The authors attribute the gene flow to introgression, but occasionally refer to hybridization and convergent evolution. Indeed, they suggest both relatively recent hybridization as well as the possibility of more ancient hybridization between warbler finches and other finches.


Clearly, this network is not particularly tree-like in places, especially with respect to the delimitation of species based on their morphology, as reflected in their current taxonomy. Nevertheless, the authors prefer to present as their main result as a:
maximum-likelihood phylogenetic tree based on autosomal genome sequences ... We used FastTree to infer approximately maximum-likelihood phylogenies with standard parameters for nucleotide alignments of variable positions in the data set. FastTree computes local support values with the Shimodaira–Hasegawa test.
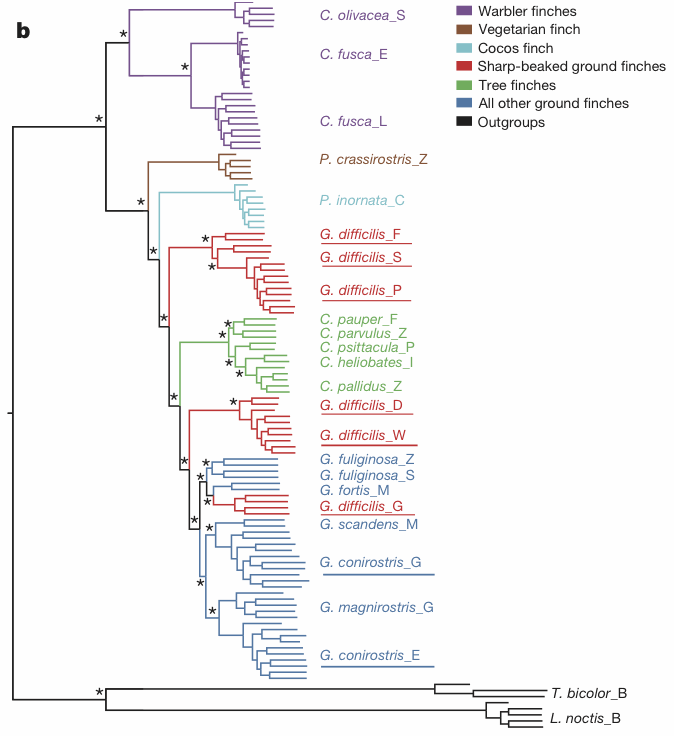
This tree is shown in the second figure.


This apparently well-supported tree is not a particularly accurate representation of the pattern shown by the network. Indeed, it makes clear just why it is inadequate to use a tree to study the interplay of intra- and inter-specific variation. Gene flow requires a network for accurate representation, not a tree.

The authors do acknowledge this situation. While they try to date the nodes on their tree, they do note that:
Although these estimates are based on whole-genome data, they should be considered minimum times, as they do not take into account gene flow.
Actually, in the face of gene flow the concept that a node has a specific date is illogical, because the nodes do not represent discrete events (see Representing macro- and micro-evolution in a network). Given the authors' final conclusion, it seems quite inappropriate to rely on trees rather than networks:
Evidence of introgressive hybridization, which has been documented as a contemporary process, is found throughout the radiation. Hybridization has given rise to species of mixed ancestry, in the past and the present. It has influenced the evolution of a key phenotypic trait: beak shape ... The degree of continuity between historical and contemporary evolution is unexpected because introgressive hybridization plays no part in traditional accounts of adaptive radiations of animals.

Wednesday, February 11, 2015

Producing trees from datasets with gene flow


Recently, a number of computer programs have been released that are intended to produce phylogenetic networks representing introgression (or admixture) (see Admixture graphs – evolutionary networks for population biology).

A recent example of the use of these programs is presented by:
Jónsson H, Schubert M, Seguin-Orlando A, Ginolhac A, Petersen L, Fumagalli M, Albrechtsen A, Petersen B, Korneliussen TS, Vilstrup JT, Lear T, Myka JL, Lundquist J, Miller DC, Alfarhan AH, Alquraishi SA, Al-Rasheid KA, Stagegaard J, Strauss G, Bertelsen MF, Sicheritz-Ponten T, Antczak DF, Bailey E, Nielsen R, Willerslev E, Orlando L (2014) Speciation with gene flow in equids despite extensive chromosomal plasticity. Proceedings of the National Academy of Sciences of the USA 111: 18655-18660.
This study presents a phylogenetic analysis of the extant genomes of the genus Equus, the horses, asses and zebras. This analysis leads the authors to the conclusion that there is "evidence for gene flow involving three contemporary equine species despite chromosomal numbers varying from 16 pairs to 31 pairs." The gene flow is indicated by the light-blue reticulations in the first diagram.


One important issue with these types of analyses is the logic on which the procedure is based. Programs like TreeMIx (used in this analysis) were developed to allow modelling of gene flow across the branches of trees at a microevolutionary (population) scale. Specifically, the graph generated by TreeMix models singular (pulse) introgression events in phylogenetic history.

The issue is that a tree is produced first, and then reticulations are added to it. The tree represents descent and the reticulations represent gene flow. But how do we produce a tree from a dataset that contains evidence of both descent and gene flow? The authors' initial tree is shown below.


The procedural logic works as follows:
(i) we assume that the traditionally recognized species exist
(ii) we assume that we have a representative sample of them, with one genome each
(iii) we construct a tree based on the assumption that there is no gene flow among the species
(iv) we then assess the species for gene flow, and discover it.

Isn't this rather circular? Surely (iv) invalidates the assumptions inherent in (i)-(iii)? How can we then assess the reliability of the sampling in (ii) and the analyses in (iii)? Why have we made assumption (i)? At best the species are fuzzy groups to one extent or another, and we do not know where we have sampled within the probabilistic space assigned to the groups.

This seems like a very poor way to go about studying the interaction between descent and gene flow. First we assume descent only, and then we assess gene flow. When we find gene flow we continue to accept the results of the initial analyses based on descent alone.

I would hate to have to justify this philosophy to someone outside phylogenetics, because I have a horrible feeling that they would either smile tolerantly or laugh outright.

This between-species situation is even more extreme for those within-species patterns where groups are recognized. Human races and domesticated breeds are two concepts that have received constant criticism. Neither races nor breeds form clear-cut groups, as there are no sharp boundaries between them, due to gene flow. Their "central locations" in genotype space are usually very different, however. Therefore it is quite possible to perform a tree-based analysis of samples from the central locations, and this would tell us a lot about descent. But it would tell us almost nothing about gene flow; and we would have a very distorted view of the phylogenetic history.

Wednesday, December 17, 2014

Current methods for evolutionary networks


It has been noted before that we have a wide range of mathematical techniques available for producing data-display networks, most notably the many variants of splits graphs (see Huson & Scornavacca 2011). For example, NeighborNets and Consensus networks are commonly encountered in the phylogenetics literature, and Reduced median networks and Median-joining networks are commonly used for haplotype networks in population biology.

However, there are few techniques used to produce evolutionary networks. Studies of reticulate evolutionary histories, which include recombination networks, hybridization networks, introgression networks and HGT networks, have no unifying theme as yet. So, the biological literature has many papers in which biologists struggle with reticulate evolutionary histories using ad hoc collections of techniques, which often boil down to simply presenting incongruent phylogenetic trees from different datasets (see Morrison 2014a).

So, maybe a brief look at the current state of play with evolutionary networks would be useful. There are enough worthwhile techniques out there for people to be using them more often than they are.

Assumptions

Almost all current phylogenetic methods assume that the basic building unit is a non-recombining sequence block, for which the evolutionary history is strictly tree-like. We tend to call these blocks "genes" and their history "gene trees", but this is just for semantic convenience. In practice, we first collect data for various loci, and we then simply make the assumption that there is recombination between the loci but not within them. This is basically the assumption of independence between loci. At the limit, each nucleotide along a chromosome has a tree-like history, but for aggregations of nucleotides it is all assumptions.

Furthermore, we assume that there are no data errors that will confound any reconstruction of the phylogenetic trees. Possible sources of error include: incorrect data (e.g. contamination), inappropriate sampling (taxa or characters), and model mis-specification. Any of these errors will lead to stochastic variation at best and to bias at worst.

Gene-tree incongruence

Reticulate evolutionary processes lead to gene trees that are not all congruent. However, there are two other processes that have been widely recognized as also producing gene-tree incongruence, but which do not involve reticulation in the strict sense: incomplete lineage sorting (deep coalescence; ancestral polymorphism), and gene duplication-loss.

Many studies have now shown that stochastic variation due to ILS can be very large (see Degnan & Rosenberg 2009), and that this varies in relation to both the population sizes of the taxa and the times between divergence events. The expectation of completely congruent gene trees is thus very naive, even when the evolutionary history of the taxa has been strictly tree-like. A number of methods have been developed to reconstruct species trees in the face of ILS (Nakhleh 2013).

DL involves gene duplication (which can be repeated to create gene families) followed by selective gene loss. The phylogenetic history of the genes is usually presented as an unfolded species tree, where each gene copy has its own part of the tree. A number of methods have been developed to reconstruct gene DL histories given a "known" species tree, which is called gene-tree reconciliation (Szöllősi et al 2015). However, our interest here is in the reverse process, in which reconstructed but incongruent gene trees are combined into a single species tree, given a model of duplication and selective loss, which is called species-tree inference (which is the same as cophylogeny reconstruction; Drinkwater & Charleston 2014).

Reticulations

Known biological processes such as recombination, reassortment, hybridization, introgression and horizontal gene transfer all create reticulate phylogenetic histories. However, it is a moot point as to whether these processes can be distinguished from each other solely in the context of an evolutionary network (Holder et al 2001; Morrison 2015). These evolutionary processes operate by distinct biological mechanisms, but the evolutionary patterns that they create can all be rather similar. The processes all result in gene flow among contemporaneous organisms (usually called horizontal flow or transfer), whereas other evolutionary processes involve gene flow from parent to offspring (usually called vertical inheritance), including ILS and DL. These gene flows create incongruent gene histories, which we may detect directly in the data or via reconstructed gene trees. The patterns of incongruence do not necessarily allow us to infer the causal process.

There are a number of differences in pattern, but the consistency of these is doubtful. Polyploid hybridization produces the most distinctive pattern, because there is duplication of the genome in the hybrid. However, subsequent aneuploidy will serve to obscure this pattern. Homoploid hybridization nominally involves 50% of the genome coming from difference sources, while introgression ultimately involves a smaller percentage. However, in practice, genome mixtures vary continuously from 0 to 50%. HGT also involves a small percentage of the genome, but in theory it also can vary from 0 to 50%. Reassortment produces mixtures of viral genes, which can occur in such a great number that reconstructing the history is severely problematic.

So, in the absence of independent experimental evidence, distinguishing one form of evolutionary network from another is almost a matter of definition. This has become increasingly obvious in the methodological literature, where semantic confusion abounds.

For example, a network produced directly from a set of characters has usually been called a "recombination network", while one produced from a set of trees has usually been called a "hybridization network", irrespective of what processes the gene trees represent. Furthermore, models that add reticulation events to DL trees have usually referred to the horizontal gene flow as "HGT", whereas models that add reticulation events to ILS trees have usually referred to the horizontal gene flow as "hybridization" (Morrison 2014a). Studies of horizontal gene flow during human evolution have usually referred to "admixture", which is a more process-neutral term.

In many, if not most, cases we might all be better off if network methods simply distinguish gene flow among contemporaries (horizontal) from gene inheritance between generations (vertical), rather than trying to infer a process — process inference can often best take place after network construction. This does not help anthropologists, of course, who are dealing with evolutionary networks where oblique gene flow is possible (so that they do not have Time inconsistency in evolutionary networks).

Methods

There seems to be a dichotomy of purposes to current method development, which are neatly summarized by the contrasting theoretical views of Mindell (2013) and Morrison (2014b). These views each recognize that evolutionary history involves both vertical and horizontal processes, but they reconstruct the resulting evolutionary patterns as a species tree and a species network, respectively. Obviously, this blog is dedicated to the latter point of view, but it is the former one (the so-called Tree of Life) that seems to currently dominate the literature.

Focussing on gene-tree inference, Szöllősi et al (2015) provide a comprehensive review of the various models that have been used to describe the dependence between gene trees and species trees. Essentially, gene trees are contained within the species tree, and they may differ from it in relative branch lengths and/or topology. The differences between genes and species are the result of population-level processes, often modeled using the coalescent. These authors recognize four current classes of probabilistic model that combine different evolutionary processes:
  • the DLCoal model, which combines coalescence and DL
  • the DTLSR model and the ODT model, both of which combine gene transfer and DL
  • models that combine hybridization and ILS
  • models of allopolyploidization.
When inferring species trees from gene trees (species-tree inference), we basically combine the scores for all of the gene trees, and then search for the species tree with the best overall score. This involves adding the scores in parsimony analyses, or multiplying the conditional probabilities in likelihood analyses (ie. maximum-likelihood or bayesian context). Many methods have been developed for inferring a species tree based on multi-locus data. These differ in whether the gene and species trees are estimated simultaneously or sequentially, and in how the gene trees are used to infer the species tree. Nakhleh (2013) and Szöllősi et al (2015) discuss both parsimony and likelihood methods for species-tree inference based on either ILS or DL models.

Extending these ideas to infer networks (rather than species trees) is a bit more tricky, and most of the work to date has involved combining hybridization and ILS. There has been no recent summary of the ideas. However, calculating the parsimony score of a network, given a set of gene-tree topologies, has been addressed by Yu et al (2011); and Yu et al (2013a) have extended these ideas to heuristically search the network space for the optimal network (the one that minimizes the number of extra reticulation lineages in a species tree). Furthermore, methods for computing the likelihood of a phylogenetic network, given a set of gene-tree topologies, have been devised by Yu et al (2012, 2013b); and Yu et al (2014) have extended these ideas to heuristically search for the maximum-likelihood network for limited cases of introgression or hybridization (since they differ only in degree).

There are also several methods that simply use gene-tree incongruence to infer reticulation events in a species network (Huson et al 2010). Basically, these methods combine gene trees into "hybridization networks" by minimizing the number of reticulations required for reconciliation, measured either by counting the reticulations or calculating the network level. The combinatorial optimization can be based on trees, triplets or clusters, using parsimony as the optimality criterion. These methods model homoploid hybridization by assuming that reticulation is the sole cause of all gene-tree incongruence. This means that they are likely to overestimate the amount of reticulation in a dataset when other processes are co-occurring.

The most completely developed network methods involve data for allopolyploid hybrids. Here, there are multiple copies of each gene, one in each copy of the genome, so that allopolyploid hybrids have more copies than do their diploid parent taxa. To construct a hybridization network topology, Huber et al (2006) developed a parsimony method based on first estimating a multi-labeled gene tree, and then searching for the single-labeled network that best accommodates the multiple gene patterns. The model has been extended to heuristically include ILS (Marcussen et al 2012), as well as dates for the internal nodes (Marcussen et al 2015). Jones et al (2013) have also developed models that incorporate ILS in a bayesian context, but only for the case of a single hybridization event between two diploid species (an allotetraploid).

Species-tree inference for a pair of gene phylogenies that may be networks not trees, has been considered in terms of parsimony by Drinkwater & Charleston (2014).

This brings us to the matter of introgression. The massive recent influx of genome-scale data for hominids has lead to the development of methods explicitly for the analysis of what is termed admixture among the lineages. These methods basically work by constructing a phylogenetic tree that includes admixture events, the topology inference being based on allele frequencies. There has been no formal comparison of the methods, and not much application to non-humans. Three such methods have been produced so far (Patterson et al 2012; Pickrell & Pritchard 2012; Lipson et al 2013).

Recombination has somewhat been the poor cousin to other causes of reticulation, as most network methods assume it to be absent. Nevertheless, Gusfield (2014) has recently provided an ample survey of the study methods available to date.

References

Degnan JH, Rosenberg NA (2009) Gene tree discordance, phylogenetic inference and the multispecies coalescent. Trends in Ecology & Evolution 24: 332-340.

Drinkwater B, Charleston MA (2014) An improved node mapping algorithm for the cophylogeny reconstruction problem. Coevolution 2: 1-17.

Gusfield D (2014) ReCombinatorics: the Algorithmics of Ancestral Recombination Graphs and Explicit Phylogenetic Networks. MIT Press, Cambridge.

Holder MT, Anderson JA, Holloway AK (2001) Difficulties in detecting hybridization. Systematic Biology 50: 978-982.

Huber KT, Oxelman B, Lott M, Moulton V (2006) Reconstructing the evolutionary history of polyploids from multilabeled trees. Molecular Biology & Evolution 23: 1784-1791.

Huson D, Rupp R, Scornavacca C (2010) Phylogenetic Networks: Concepts, Algorithms, and Applications. Cambridge University Press, Cambridge.

Huson DH, Scornavacca C (2011) A survey of combinatorial methods for phylogenetic networks. Genome Biology & Evolution 3: 23-35.

Jones G, Sagitov S, Oxelman B (2013) Statistical inference of allopolyploid species networks in the presence of incomplete lineage sorting. Systematic Biology 62: 467-478.

Lipson M, Loh P-R, Levin A, Reich D, Patterson N, Berger B (2013) Efficient moment-based inference of population admixture parameters and sources of gene flow. Molecular Biology & Evolution 30: 1788-1802.

Marcussen T, Heier L, Brysting AK, Oxelman B, Jakobsen KS (2015) From gene trees to a dated allopolyploid network: insights from the angiosperm genus Viola (Violaceae). Systematic Biology 64: 84-101.

Marcussen T, Jakobsen KS, Danihelka J, Ballard HE, Blaxland K, Brysting AK, Oxelman B (2012) Inferring species networks from gene trees in high-polyploid north American and Hawaiian violets (Viola, Violaceae). Systematic Biology 61: 107-126.

Mindell DP (2013) The Tree of Life: metaphor, model, and heuristic device. Systematic Biology 62: 479-489.

Morrison DA (2014a) Phylogenetic networks: a review of methods to display evolutionary history. Annual Research and Review in Biology 4: 1518-1543.

Morrison DA (2014b) Is the Tree of Life the best metaphor, model or heuristic for phylogenetics? Systematic Biology 63: 628-638.

Morrison DA (2015, in press) Pattern recognition in phylogenetics: trees and networks. In: Elloumi M, Iliopoulos CS, Wang JTL, Zomaya AY (eds) Pattern Recognition in Computational Molecular Biology: Techniques and Approaches. Wiley, New York.

Nakhleh L (2013) Computational approaches to species phylogeny inference and gene tree reconciliation. Trends in Ecology & Evolution 28: 719-728.

Patterson NJ, Moorjani P, Luo Y, Mallick S, Rohland N, Zhan Y, Genschoreck T, Webster T, Reich D (2012) Ancient admixture in human history. Genetics 192: 1065-1093.

Pickrell JK, Pritchard JK (2012) Inference of population splits and mixtures from genome-wide allele frequency data. PLoS Genetics 8: e1002967.

Szöllősi GJ, Tannier E, Daubin V, Boussau B (2015) The inference of gene trees with species trees. Systematic Biology 64: e42-e62.

Yu Y, Barnett RM, Nakhleh L (2013a) Parsimonious inference of hybridization in the presence of incomplete lineage sorting. Systematic Biology 62: 738-751.

Yu Y, Degnan JH, Nakhleh L (2012) The probability of a gene tree topology within a phylogenetic network with applications to hybridization detection. PLoS Genetics 8: e1002660.

Yu Y, Dong J, Liu KJ, Nakhleh L (2014) Maximum likelihood inference of reticulate evolutionary histories. Proceedings of the National Academy of Sciences of the USA 111: 16448-16453.

Yu Y, Ristic N, Nakhleh L (2013b) Fast algorithms and heuristics for phylogenomics under ILS and hybridization. BMC Bioinformatics 14: S6.

Yu Y, Than C, Degnan JH, Nakhleh L (2011) Coalescent histories on phylogenetic networks and detection of hybridization despite incomplete lineage sorting. Systematic Biology 60: 138-149.

Wednesday, September 17, 2014

Using data-display networks to assess evolutionary inferences


Phylogenetic networks are of two types: those that produce direct evolutionary inferences about gene flow (eg. hybridization networks, HGT networks), and those that display multiple patterns in multivariate datasets without any necessary evolutionary implications. The latter (called data-display networks) can be used both a priori as tools for exploratory data analysis (EDA), and a posteriori as a means of evaluating (or cross-checking) the support for inferences derived from other analyses (such as evolutionary networks).

Here, I present an example of the a posteriori usage.


The data and initial analysis come from:
Fu Q, Meyer M, Gao X, Stenzel U, Burbano HA, Kelso J, Pääbo S. (2013) DNA analysis of an early modern human from Tianyuan Cave, China. Proceedings of the National Academy of Sciences of the USA 110: 2223-2227.
They describe their genome data and evolutionary analysis like this:
We have extracted DNA from a 40,000-year-old anatomically modern human from Tianyuan Cave outside Beijing, China.
To investigate the relationship of the Tianyuan individual to present-day populations, we compared it to chromosome 21 sequences from 11 present-day humans from different parts of the world (a San, a Mbuti, a Yoruba, a Mandenka, and a Dinka from Africa; a French and a Sardinian from Europe; a Papuan, a Dai, and a Han from Asia; and a Karitiana from South America) and a Denisovan individual, each sequenced to 24- to 33-fold genomic coverage. Denisovans are an extinct group of Asian hominins related to Neandertals [and used as an outgroup]. In the combined dataset, 86,525 positions variable in at least one individual are of high quality in all 13 individuals.
To more accurately gauge how the population from which the Tianyuan individual is derived was related to Eurasian populations, while taking gene flow between populations into account, we used a recent approach that estimates a maximum-likelihood tree of populations and then identifies relationships between populations that are a poor fit to the tree model and that may be due to gene flow [using the TreeMix program] ... The maximum-likelihood tree [reproduced above] shows that the branch leading to the Tianyuan individual is long, due to its lower sequence quality. However, among Eurasian populations, Tianyuan clearly falls with Asian rather than European populations (bootstrap support 100%). The strongest signal not compatible with a bifurcating tree is an inferred gene-flow event that suggests that 6.7% of chromosome 21 in the Papuan individual is derived from Denisovans ... When this is taken into account, the Tianyuan individual appears ancestral to all Asian individuals studied. We note, however, that the relationship of the Tianyuan and Papuan individuals is not resolved (bootstrap support 31%).
Setting aside the faux pas about the Tianyuan individual being "ancestral" to the others (it is shown in the tree-based figure as the sister group not the ancestor), most of the other interpretations can be assessed by looking at the multivariate data independently of any evolutionary inference. This can be done using the pairwise nucleotide differences among the samples (provided in Table 1 of the paper) and a NeighborNet data-display network, as shown in the splits graph below.


We can note the following points, some of which support the authors' conclusions and some of which don't. [Note: the authors refer to their figure as a "tree", although it is an introgression network.]:
  • All terminal edges in the network are long, and so there is actually not much genomic information on chromosome 21 about relationships.
  • The network splits do roughly match the tree splits, and so the network apparently does reflect some evolutionary information.
  • The identified gene flow from the Denisovan to the Papuan is represented by a clear split in the network. The weight (0.7335) makes it the fifth largest non-trivial split. That is, it is larger than some of the splits that purportedly represent tree-like evolution.
  • The largest split (weight = 2.8942) separates the non-African samples from the African samples + Denisovan outgroup, which does accord with the postulated dispersal of humans out of Africa.
  • The second (1.1459) and third (0.8073) largest splits are near the root of the tree.
  • The European split is the fourth largest (0.7670). The South American sample is included with the Asian group, reflecting the idea that the native people of the Americas migrated there from Asia across the Bering Strait.
  • The relationships among the Asian samples in the network do not all match those in the tree. Notably, the Han+Dai split (0.5124) is smaller than the Han+Karitiana split (0.6292), and yet the former appears in the tree with 100% bootstrap support.
  • The Han+Dai+Karitiana split is well supported (0.4450), but the Han+Dai+Karitiana +Papuan split is not (0.0152), as reflected in the 31% bootstrap value for the latter in the tree.
  • The Han+Dai+Karitiana+Papuan+Tianyuan split is not displayed in the network, although it has a long edge in the tree. The closest network split, as displayed, includes the Denisovan sample. Thus, the network emphasizes the reticulate Denisovan-Papuan relationship at the expense of the showing all of the tree-like relationship among the Asian samples.
  • The Tianyuan edge is not long in the network whereas it is long in the tree. This is likely to be because of uncertainty in its placement in the tree, rather than poor sequence quality, as claimed by the authors.

Thus, the data-display network questions some of the details of the authors' evolutionary network. However, it does support placing the Tianyuan sample with the Asian ones, as well as possible gene flow from the Denisovan sample to the Papuan one.

It thus seems to be a valuable procedure to cross-check any evolutionary analysis with a data-display network. As I have noted before (Networks and bootstraps as tree-support criteria; How networks differ from bootstrapped trees), bootstap values on a tree are insufficient as a means of assessing the robustness of evolutionary diagrams.

Wednesday, September 3, 2014

Charles Darwin and the coalescent


The full title of Charles Darwin's most famous book was On the Origin of Species by Means of Natural Selection, or the Preservation of Favoured Races in the Struggle for Life. It is important to note that this title juxtaposes the concepts of between-species variation and within-species variation (Darwin usually referred to "races" rather than to "breeds", "subspecies", etc). This was one of his major insights: the idea that there is a continuum of variation in biology through time (or, as he put it, that it is arbitrary whether variants are treated as different races or as different species).

As I recently noted, this paved the way for between-species phylogenies to be seen as directly analogous to within-species genealogies (The role of biblical genealogies in phylogenetics) — previous applications of genealogies to non-humans (such as those of Buffon and Duchesne) had been explicitly restricted to within-sepcies relationships.

This conceptual integration of within-species and between-species relationships has become explicit in modern biology by using multispecies coalescent models to integrate population genetics and phylogenetics. As noted by Reid et al. (2014):
These models treat populations, rather than alleles sampled from a single individual, as the focal units in phylogenetic trees. The multispecies coalescent model connects traditional phylogenetic inference, which seeks primarily to infer patterns of divergence between species, and population genetic inference, which has typically focused on intraspecific evolutionary processes. The development of these models was motivated by the common empirical observation that genealogies estimated from different genes are often discordant and the discovery that, if ignored, this discordance can bias parameters of direct interest to systematists, such as the relationships and divergence times among species.
However, as specifically emphasized by Reid et al.:
In order to reconcile discordance among gene trees and uncover true species relationships, the first gene tree/species tree models assumed that discordance is solely the result of stochastic coalescence of gene lineages within a species phylogeny ... Coalescent stochasticity, however, is not the only source of gene tree discordance. Selection, hybridization, horizontal gene transfer, gene duplication/extinction, recombination, and phylogenetic estimation error can also result in discordance.
They examined this situation by studying the fit of the multispecies coalescent model:
to 25 published data sets. We show that poor model fit is detectable in the majority of data sets; that this poor fit can mislead phylogenetic estimation; and that in some cases it stems from processes of inherent interest to systematists ...
Our analyses suggest that poor fit to the multispecies coalescent model can mislead inference in empirical studies. In the case of recent hybridization, the consequences may be severe, as species divergences are forced to post-date gene divergences ... When topological conflict among coalescent genealogies is the result of ancient hybridization, balancing selection, or gene duplication and extinction, the consequences may be less severe.
In other words, tree-based phylogenetics is inadequate in practice because of gene flow. Within-species genealogies and between-species phylogenies intersect in the concept of a network, not a tree. That is, the multispecies coalescent needs to be based on a network model not a tree model:
The biological processes that generate variation in gene tree topologies should be explicitly modeled, as should relevant dynamics of molecular evolution. Increasingly complex multispecies coalescent models are being implemented, but there are tradeoffs. Some examine gene duplication and extinction or migration but cannot estimate divergence times.
So, current models are inadequate. It will be interesting to see how these approaches develop to incorporate gene flow (reticulation) into what has heretofore been a tree model (modeling only ancestor-descendant relationships), as we are still in need of methods for estimating rooted evolutionary networks.

Reference

Reid NM, Hird SM, Brown JM, Pelletier TA, McVay JD, Satler JD, Carstens BC (2014) Poor fit to the multispecies coalescent is widely detectable in empirical data. Systematic Biology 63: 322-333.

Monday, November 25, 2013

Toulouse-Lautrec: family trees and networks


In a previous blog post (Charles Darwin's family pedigree network), I mentioned several well-known people who were involved in a consanguineous marriage, which is defined as the union of two people who are related as closer than second cousins. In that post I discussed in detail Charles Darwin (who married his first cousin); and in this post I discuss the artist Henri Toulouse-Lautrec, who was the offspring of a marriage between first cousins.


I thought that this would be a simple post, because there must be people who have studied the Toulouse-Lautrec-Montfa genealogy, given Henri's fame as a Post-Impressionist artist, along with the widespread knowledge that his phyiscal disabilities were genetic. But it turned out not to be so — there is no broad family tree that I could find, and no detailed discussion of inbreeding. The main information easily available is the direct lineage of inheritance of the various noble titles to which Henri would have been heir (had he survived his father, the Comte de Toulouse-Lautrec-Montfa), which can be traced back for more than 1000 years (see Vizegrafschaft Lautrec). However, the main interest for biology lies in his genetic relationship with his cousins, as we shall see below.

So, I sat down for a day to compile the family history for myself. The resulting genealogy is incomplete, but all of the relevant people are in it. I could not find all of the details about some of these people, either, which are apparently not available on the web; and some of the actual dates are inconsistent across different sources. In general, I have followed Dupic (2012).

When genealogical trees become networks

The point of this post is that marriages within a family turn the family tree into a network. So, a pedigree can be tree-like or not. In the latter case it is an example of a hybridization network.


This first genealogy shows a standard family tree for a single individual, looking backward in time from the bottom. So, this person is #1, the parents are #2 (father) and #3 (mother), and so on back through the generations, always with the male parent on the left (as is the convention). This example covers six generations, showing that without inbreeding everyone has 32 great-great-great grand-parents. These 32 people's genes are mixed more-or-less randomly (depending on recombination and assortment) to produce person #1. This is a good thing, evolutionarily, because there is then genetic diversity within #1.

However, with inbreeding some part of the ancestry disappears (when looking backward in time), because another part of the ancestry is duplicated in its place (this is called "pedigree collapse").


The second genealogy shows what happens when person #7 is the daughter of someone else in the same pedigree. If she is the daughter of #10 and #11, for example, then #5 and #7 would be sisters, and #2 and #3 would be first cousins. Now, person #1 has only 24 great-great-great grand-parents, and some of them are contributing to their descendants twice, rather than once (ie. #40–#47). This means that the genetic diversity in person #1 is less than it would be without the inbreeding. More to the point, any recessive alleles that exist in the ancestry have an increased probability of being homozygous in #1, and thus being expressed in the phenotype.

Toulouse-Lautrec's ancestry

This is, unfortunately, exactly what happened to Henri Toulouse-Lautrec, whose pedigree network is shown in the next figure. It is complete for six generations, plus an important part of the seventh. It is difficult to be complete beyond this generation, as the information becomes sparse, particularly about the female family members.

Henri Toulouse-Lautrec family tree

As shown, Henri's parents were first cousins, because their mothers were sisters. In addition, his maternal grandfather (#6) also had recent inbreeding in his history, because his mother (#13) was the daughter of a first-cousin marriage. This is not nearly as much inbreeding as has been implied by most commentators about Henri's life, but it is enough to potentially create genetic problems.

Note that it was Henri's mother's side of the family that was involved in the recent inbreeding, but the de Toulouse-Lautrec Montfa side was prone to the same thing, as are most titled families. As noted above, Henri died before inheriting his title. The title Comte de Toulouse-Lautrec-Monfa passed to Alphonse' next brother, Charles (1840-1917), who had no children, and thence to the next brother, Odon (1842-1937), and finally to Odon's son, Robert (1887-1972), who also had no children. The Internet seems to be silent about what happened to it after that.

Consequences of inbreeding

For Henri, life was tragic because he ended up with two copies of one particular recessive allele. The medical profession has been interested in this ever since his death, and much information is therefore now available about his condition (eg. Albury & Weisz 2013; Leigh 2013).


Albury & Weisz (2013) note:
The condition from which he probably suffered was first described in 1954 by the French physician Robert Weissman-Netter. It was named pycnodysostosis in 1962 by Marateaux and Lamy and was soon attributed to this artist as the "Toulouse-Lautrec Syndrome" ... Pycnodysostosis is a hereditary autosomal recessive dysplasia caused by an enzyme deficiency, namely of cathepsin K (cysteine protease deficiency in osteoclasts), reducing the normal bone resorption and leaving an incomplete matrix decomposition ... Toulouse Lautrec had a short stature with shortened legs, a large head due to a lack of closure of the fontanellae (which he usually covered with a hat), a shortened mandible with an obtuse angle (covered with a thick beard), dental deformities that required several surgical interventions, a large tongue, thick lips, profuse salivation, and a sinus obstruction with post-nasal drip. With fractures of the long bones during childhood, later on of the clavicle, with progressive hearing problems and cranio-facial deformities, Lautrec’s condition would complete the diagnosis of pycnodysostosis.
It seems to be widely recognized that Henri threw himself into his art at least partly to compensate for the psychological damage produced by his physical condition (he also became an alcoholic). As Leigh (2013) notes, his mother's side of the family had money (his father's side had a title but little money), and so Henri was financially free to do what he liked. He worked at a prodigious rate, and produced a life-time's worth of art in just 15 years — perhaps most famously his flamboyant lithograph posters (still as popular today as they were in his own time), but also oil paintings, watercolours, sculptures, ceramics and stained glass. He died at his mother's Château Malromé at age 36, after a stroke, but ultimately probably from tuberculosis (Albury & Weisz 2013).

Further inbreeding in the family

I noted in my previous post about Charles Darwin that, not only did he marry his cousin, his own sister married his wife's brother, thus literally keeping things in the family. In Henri Toulouse-Lautrec's case, the same thing happened: his paternal aunt married his maternal uncle, as shown in the next figure. This pedigree shows some more information about Henri's closest relatives, emphasizing the pair of consanguineous marriages.

Henri Toulouse-Lautrec family members

There are 14 people shown in Henri's generation, all born to first-cousin marriages. (There may have been two more children in the Alix–Amédée marriage, but I have been unable to find any direct reference to them.) Of these people, six seem to have had disabilities similar to Henri's: Henri himself; his brother, who died the day before his first birthday; Madeleine, who died as a teenager; Geneviève; Béatrix; and Fides. The latter was so small that apparently she lived her entire life in a baby carriage (Rosenhek 2009). The photo below shows Henri with most of the Tapié de Céleyran family. It was taken in the summer of 1896 at Château du Bosc, where Henri had been born.

The two elderly women in the middle are Gabrielle (left) and Louise (right), the maternal and paternal grandmothers (they were sisters, remember). The father, Amédée, is at the rear centre (sticking his tongue out at the photographer), and the mother, Alix, is standing at the far right. Standing next to her is the oldest son, Raoul; and his wife, Elisabeth, is seated at the far left. The next two sons, Gabriel and Odon, are absent, along with their wives. The next son, Emmanuel, is standing at the back left; and his wife, Marie-Thérèse, is seated next to the pram (middle right). The youngest sons are sitting on the ground at the front centre, with Alexis on the left and Olivier on the right. The first-born daughter, Madeleine, was already dead when the photo was taken. The next three daughters are sitting at the middle left, with Germaine sitting on Elisabeth's lap, Geneviève in front of her, and then Marie seated on the ground. Béatrix is at the middle right, sitting next to Marie-Thérèse, and Fides is in her pram. Henri himself is seated on the ground at the far left. His brother, Richard, had also died before the photo was taken. The remaining four people (standing either side of Amédée) are other relatives.
Nevertheless, this large family did manage to survive the effects of inbreeding, unlike Henri's own family. At least seven of the children survived to have children of their own (~19 grand-children):
Person
Raoul
Gabriel
Odon
Emmanuel
Germaine
Marie
Alexis
Spouse
Elisabeth DAUDÉ de LAVALETTE (1870-1956)
Anne de TOULOUSE-LAUTREC (1873-1944)
Marguerite TAILLEFER de LAPORTALIÈRE (1878-1958)
Marie-Thérèse des CORDES
Alexandre d'ANSELME (1876-1912)
Adrien de RODAT d'OLEMPS (1806-1884)
Anne Marie de MALVIN de MONTAZET (1885-1974)

4 children
3 children
1 child
2 children
2 children
3 children
4 children
Note that Gabriel and Anne were third cousins, since they had great-grand-fathers who were brothers; nevertheless, they had 3 female children, at least one of whom also had 3 children. One of Alexis' sons (ie. Henri's second cousin once removed) was well-known art critic Michel Tapié de Céleyran (1909-1987), who married and had seven children, two of whom died in infancy.

Inbreeding increases the probability that recessive alleles will be expressed, but it does not make this inevitable. In Henri's case, two disabled children in succession seems to have dissuaded his parents, and they separated, whereas his aunt and uncle had a healthy child the second time, and so they continued producing a family. However, these days it is not recommended that you marry any of your first cousins.

Conclusion

Evolution is about biodiversity at all hierarchical levels, not just between or within species, but within individuals as well. Average intra-individual genetic diversity reaches a maximum when the ancestry is tree-like, and reduces with each instance of inbreeding, which turns the tree into a network of increasingly greater complexity.

I have discussed an even more extreme example of consanguinity in a previous post (Family trees, pedigrees and hybridization networks), in which the inbreeding became so severe that the royal family lineage actually came to an end.

References

Albury WR, Weisz GM (2013) Toulouse-Lautrec and medicine: a triumph over infirmity. Hektoen International 5: 3.

Dupic S. (2012) Toulouse-Lautrec - Généalogie 87 le site de référence de la généalogie de la haute-vienne.

Leigh FW (2013) Henri Marie Raymond de Toulouse-Lautrec-Montfa (1864-1901): artistic genius and medical curiosity. Journal of Medical Biography 21: 19-25.

Rosenhek J (2009) Picture imperfect: tiny Henri de Toulouse-Lautrec’s talent – and troubles – were larger than life. Doctor's Review Oct 2009.

Monday, May 27, 2013

Charles Darwin's family pedigree network


It is widely known that Charles Darwin was married to his first cousin Emma Wedgwood. Emma came with a substantial dowery, being the grand-daughter of Josiah Wedgwood, the founder of the Wedgwood pottery firm (as, indeed, was Darwin himself, via his mother). Darwin already had a substantial allowance from his own father (a successful physician, real estate speculator, investor, and money lender), and the combined incomes allowed him to live the life of a "gentleman of independent means". He thus conducted his scientific work unhindered by the practical concerns of the rest of us.


What is perhaps less well known is that Darwin was interested in (and concerned about) the genetic effect on his children of his consanguineous marriage. He performed many experiments on inbreeding in plants, and demonstrated that the offspring of cross-fertilized plants were more vigorous and numerous than the offspring of self-fertilized plants. It occurred to him that the same thing might be true for animals, as well, including humans.

Furthermore, he thought that this might be an explanation for the unhealthy nature of his own children. Three of his ten children died young, and three more of them had long-term marriages that produced no offspring (implying infertility). These data stand out even within the Darwin-Wedgwood families, let alone outside it.

In birth order, the children were:
William Erasmus – married, no children
Anne Elizabeth – died young (tuberculosis)
Mary Eleanor – died young
Henrietta Emma – married, no children
George Howard – married, four children
Elizabeth – unmarried, no children (apparently had difficulties with words and pronunciation)
Francis – married twice, two children
Leonard – married twice, no children
Horace – married, three children
Charles Waring – died young

Part of the Darwin / Wedgwood pedigree is shown in the figure, which is taken from the 2010 paper by Tim M. Berra, Gonzalo Alvarez and Francisco C. Ceballos (Was the Darwin / Wedgwood dynasty adversely affected by consanguinity? BioScience 60: 376-383). Note that the family tree is drawn as a hybridization network (also called a "path diagram"), rather than a traditional family tree, which is an important point that I have previously emphasized for pedigrees (Family trees, pedigrees and hybridization networks).


The diagram shows only four of the people from Darwin's children's generation (including only one of his own children), but all four of these people (and their unshown siblings) are the offspring of first-cousin marriages. Indeed, Louisa Frances Wedgwood's parents were double first cousins (ie. they were cousins via both of their parents). These consanguineous marriages all involved the children of Josiah Wedgwood II (they are four of his eight children who survived to adulthood) — this is not a family tradition that should be encouraged. (You will note that Darwin's sister Caroline married Emma's brother Josiah III, thus literally keeping everything in the family.)

The inbreeding coefficient (the probability that at a given locus an individual receives two identical genes as a result of common ancestry) of Louisa Frances is 0.126, while that of the other three people is 0.063. Most of the other people in the Darwin / Wedgwood family have inbreeding coefficients of 0.000. Berra and his coauthors compared the child mortality with the inbreeding coefficients for four generations of the family, and concluded that there is a statistically significant relationship.

The data look like this for the 20 marriages in the final three generations:
                         Child mortality to 10 years
                                 =0     >0
Inbreeding coefficient =0        11      5
                       >0         1      3
Clearly, the second sample size is rather small, but the unconditional test of two independent proportions yields p=0.076. The relative risk is 2.4 (ie. the children of first-cousin marriages were >2 times more likely to die before 10 years of age than were the other children).

Darwin did not have easy access to these data, of course, but they justify his concern for the effect on humans of inbreeding. Indeed, he went so far as to suggest that the 1871 British census should enquire about consanguineous marriages ("the returns would show whether married cousins have in their households on the night of the census as many children as have parents who are not related; and should the number prove fewer, we might safely infer either lessened fertility in the parents, or which is more probable, lessened vitality in the offspring"). This suggestion was not implemented.

However, his son George (the oldest fertile child) did persue the matter of inbreeding. Indeed, he introduced the idea of using the frequency of occurrence of the same (birth) surname among married couples as a means to study the level of inbreeding in a population. Such surname models are still used in human population biology today.

Henri de Toulouse-Lautrec
1864-1901

Incidentally, many other famous people have married their first cousin, although unlike Darwin they did not necessarily have any children with them. For example, Albert Einstein married Elsa Löwenthal (née Einstein), his first cousin through their mothers and second cousin through their fathers; however, his three children were from his relationship with his first wife, Mileva Marić. H.G. Wells' first marriage was to Isabel Wells, a first cousin, but his four children were with his second wife and two of his lovers. Edgar Allan Poe's only marriage was to his cousin Virginia Clemm, but they had no children. [See the later post: Albert Einstein's consanguineous marriage]

Sadly, there are also well-known cases where the offspring of first cousins seem to have suffered badly. Perhaps the best known of these is the artist Henri de Toulouse-Lautrec. Henri's two grandmothers were sisters, so that his parents were first cousins, and he suffered from congenital health conditions that are usually attributed to genetic disorders. For example, Henri fractured his right thigh bone when he was 13 and his left at 14, and the breaks did not heal properly. His legs ceased to grow, so that he achieved the shape for which he is best known, with an adult-sized torso but child-sized legs. He died at the young age of 36. [See the later post Toulouse-Lautrec: family trees and networks]

First-cousin marriages have declined significantly since Darwin's time. According to Adam Kuper (2010. Incest and Influence: the Private Life of Bourgeois England. Harvard University Press), cousin marriages have declined from 1:25 marriages (among the upper middle classes) in the 19th century to 1:6,000 in the 1930s and 1:25,000 in the 1960s. Kuper's book provides an interesting insight into why such marriages were previously so common among the upper bourgeoisie and why they are much rarer now.

Wednesday, March 20, 2013

First-degree relationships and partly directed networks


I have noted before that a pedigree is a network not a tree, and specifically it is a hybridization network (Family trees, pedigrees and hybridization networks). That is, in sexually reproducing species, every offspring is the hybrid of two parents. If we include both parents in the pedigree, plus all of their relatives, then this will form a complex network every time inbreeding occurs.

This situation can be generalized to groups of closely related individuals, such as cultivated plants and domesticated animals, where human-mediated inbreeding has resulted in the formation of new breeds and cultivars with limited genetic diversity. In the extreme case, the network will consist of first-degree relationships, where the branches connect parent-offspring relationships or sibling relationships.

An example of this is provided by the work on the genetics of grape cultivars by Myles et al. (Myles S, Boyko AR, Owens CL, Brown PJ, Grassi F, Aradhya MK, Prins B, Reynolds A, Chia JM, Ware D, Bustamante CD, Buckler ES. 2011. Genetic structure and domestication history of the grape. Proceedings of the National Academy of Sciences of the USA 108: 3530-3535).


The genotype data were generated from a custom microarray, which assayed 5,387 SNPs genotyped in 583 unique Vitis vinifera samples from the US Department of Agriculture (USDA) germplasm collection. Estimates of identity-by-descent (IBD) were calculated based on linkage analysis for all pairwise comparisons of samples. These IBD values were calibrated based on known pedigree relationships (ie. confirmed parent-offspring relationships), and this was used to differentiate between parent-offspring and other pedigree relationships. For each cultivar that was related to at least two other cultivars by an estimated parent-offspring relationship, the proportion of SNPs consistent with Mendelian inheritance was used to determine the two parents.

The authors found that 75% of the grape cultivars were related to at least one other cultivar by a first-degree relationship. The first figure (above) shows the frequency histogram of these first-degree relationships, along with the resulting complex pedigree structure, which can be visualized as a set of undirected networks. This set is dominated by a single network with 58% of the cultivars, each related to at least one other cultivar by a first-degree realtionship.

Fig. 3. Network of first-degree relationships among common grape cultivars.
Solid edges represent likely parent-offspring relationships. Dotted edges represent sibling
relationships or equivalent. Arrows point from parents to offspring for the inferred triplets.

The authors inferred that about half of the first-degree relationships were likely to be parent-offspring, with the other half being labeled "sibling or equivalent" (because complex crossing schemes can generate IBD values that are indistinguishable from sibling relationships). By evaluating Mendelian inconsistencies, they assigned parentage for 83 triplets of cultivars. The second figure shows a directed hybridization network of some well-known grape cultivars that includes several resolved triplets.

Note that the hybridization network is only partly directed — quite a few of the edges do not have a uniquely identified direction, based on the SNP data. This is an issue that I have not seen directly addressed in the literature. Practitioners tend to treat phylogenetic networks (and trees) as either directed or undirected, rather than a mixture of both, as this characteristic is determined by the presence or absence of a root node. However, in the grape case there is no root identifiable based on the cultivar SNP data. (There is a scenario for the origin of modern grape cultivars from Vitis sylvestris around the eastern Mediterranean, but even this is complicated by hypothesized later gene flow between V. sylvestris and V. vinifera.)

Perhaps the possibility of partly directed phylogenetic networks needs more consideration.

Wednesday, November 14, 2012

Family trees, pedigrees and hybridization networks


A family tree is technically called a pedigree. This is because it is not really a tree. Branches do not fuse in a tree, whereas in a pedigree every individual is the fusion of two genealogical branches. That is, in sexually reproducing species, every offspring is the hybrid of two parents. A family tree is only a tree if you trace one pair of ancestors through their descendants while ignoring the spouses.

So, a pedigree is a network not a tree, and specifically it is a hybridization network. This can be seen most clearly when there is a considerable level of inbreeding going on. Under these circumstances, both spouses are likely to be offspring of the same ancestors in the not-too-distant past, and so they will both be connected by the network branches. We are all of us connected in the human pedigree network, of course, but for most of us our (shared) common ancestor is a long way back in the past.

A high degree of inbreeding is common in many human cultures, but it is particularly prevalent among royalty, even in cultures with relatively little inbreeding among the common populace. I will illustrate this phenomenon with what is often considered to be the most extreme example recorded — the inbreeding that lead to the demise of the Spanish branch of the Habsburg dynasty in 1700 (other branches of the House of Austria continued until 1780).

The Spanish branch of the Habsburgs were kings of Spain from 1516 to 1700. Under Habsburg rule, Spain reached the peak of its power in Europe (covering Spain, the Netherlands and parts of Italy), and the world-wide Spanish Empire reached its greatest extent. The last king of this dynasty was Charles II, who was the product of such serious inbreeding that he was disfigured, physically disabled and mentally retarded (see Alvarez et al. 2009 for a full description). The fact that he had no children lead to the War of the Spanish Succession, although this was mostly precipitated by the reaction of the reigning French king, Louis XIV.

Click to enlarge.

The basic issue here is that the Spanish Habsburgs tried to keep power by literally "keeping it in the family". During the last three-quarters of their time, from 1551 to 1700, no outsider married into the Spanish royal family. Indeed, if one looks at the six kings from 1497 (when Philip the Fair married Joanna I of Castile and Aragon, and thus became Philip I), then we note that there were 11 marriages, most of which were among blood relatives — two uncle-niece marriages, one double first cousin marriage, one first cousin marriage, two first cousins once removed marriages, one second cousin marriage, and two third cousin marriages. (See Wikipedia for an explanation of these relationship terms.) This gave Charles II an inbreeding coefficient of 0.254 (calculated by Alvarez et al. 2009) — for comparison, the offspring of a brother-sister union would have a value of 0.250, as would the offspring of a parent-child union. Phillip III (Charles II's grandfather) also reached a high level: 0.218. Both of these people were the offspring of uncle-niece marriages.

This first diagram (linked from Wikipedia) shows the pedigree of Charles II, the final member of the dynasty. It illustrates the above points in the usual manner for a family tree. It shows only the royal lineage, as there were many other offspring, and indeed other marriages (Philip II married four times, Philip IV twice, and Charles II also twice). However, none of the male offspring were alive at the time of the death of Charles II, and nor were most of the females. Another of the consequences of the inbreeding was a poor survival rate among the children.


My point with this blog post is that the family tree can also be drawn as a network, as shown in the second diagram (which is also called a "path diagram" by geneticists). This illustrates the same pedigree as above, but with a few additions (at the left) to illustrate the lineage to Don Carlos (crown prince Charles), another highly inbred male (coefficient 0.211), being the offspring of double first cousins. This form of the diagram makes the connection between a family tree and a hybridization network clear — they are both ways of drawing a pedigree.

Basically, the two diagrams illustrate the same point — the Habsburg's defeated their own purpose, because they ultimately lost power by refusing to share it with anyone else. Biology is about biodiversity, and conserving biodiversity applies within your own family just as much as anywhere else.

Note
There are several follow-up posts on this topic, about other famous people:
Charles Darwin's family pedigree network
Toulouse-Lautrec: family trees and networks
Albert Einstein's consanguineous marriage

Further reading

Alvarez G., Ceballos F.C., Quinteiro C. (2009) The role of inbreeding in the extinction of a European royal dynasty. PLoS ONE 4: e5147.

If you know little about the pros and cons of inbreeding, then this blog post will enlighten you:
Why inbreeding really isn’t as bad as you think it is.