
A major application of networks in exploratory data analysis is to identify signal oddities and visualise ambiguity. Thus, they would be the natural choice when it comes to pinpointing weaknesses in phylogenetic trees. This is particularly so when the aim is to propose a relatively stable (and intuitive) ‘phylogenetic’ (identifying likely monophyla sensu Hennig) or ‘cladistic’ (clade-based) systematic framework for a group of organsims. In other words, whenever we try to translate branching patterns into monophyletic groups.
‘Weak spots’ in phylogenetic trees are relationships with either little or ambiguous support, or branching patterns strongly affected by sampling (taxa and characters). These are topological phenomena that are rather the rule than the exception when studying extinct groups of organisms (e.g. spermatophytes or ‘long-necks’).
One example appears to be probably one of the fiercest group of marine predators: the mosasaurs (mosasauroid squamates; Madzia & Cau 2017). I will discuss this example in this post.
 |
Fig. 1. The tree-based systematic groups of mosasaurs (Mosasauroidae plus ancient relatives) when applying Madzia & Cau's nomenclature to their Bayesian-inferred majority-rule consensus tree. Most higher taxa (above genus) are "branch-based", except for the "node-based" Mosasauridae, Russellosaurina (wrong suffix, kept as rank-less taxon by the authors), Tethysaurinae, and Yaguarasaurinae. Genera represented by a single OTU in blue, 'non-monophyletic' genera in red. Thick branches received near unambiguous support (PP ≥ 0.95)
|
Madzia & Cau “re-examined a data set that results from modifications assembled in the course of the last 20 years and performed multiple parsimony analyses and Bayesian tip-dating analysis” in order to identify the ‘weak spots’ and take them into account when providing a revised cladistic nomenclature of “the ‘traditionally’ recognized mosasauroid clades” (Fig. 1). They define possibly monophyletic groups via recurring branching patterns in their various trees, along with the position of key taxa in those trees (see their chapter Phylogenetic [in fact: cladistic] nomenclature). This allows the groups to “self-destruct” when not forming a clade, and to be replaced.
Although the combination of unweighted and differentially weighted parsimony and Bayesian tip-dating analyses could be methodologically interesting (when examined in detail), it is hardly necessary in order to identify weaknesses and strengths of the data matrix used – going back to Bell 1997, and being emended since (see Introduction of Madzia & Cau) – to define possible monophyletic (or other) groups. A quick and simple neighbour-net splits graph would have done the trick, too.
The situation regarding tree inference, e.g. parsimony
The mosasaurid data matrix suffers from the typical problems: ambiguous, highly homoplasious signals, paired with a few missing data issues (typically lack of data overlap). Adding to this is the miscellaneous signal from taxa regarded as outgroups (here: ancient potential members of the mosasaurs): Adriosaurus suessi (which the authors used to root their trees), Dolichosaurus longicollis, and Ponto-saurus kornhuberi. Accordingly, standard parsimony analysis fails to provide a useful result for about half of the taxa, when documented in the traditional fashion (see my last post) — a strict consensus cladogram of all most parsimonious trees (MPTs) is shown in Fig. 2A.
 |
| Fig. 2 Strict consensus graphs based on 152 equally (most) parsimonious trees inferred from the matrix (all characters treated as unweighted and unordered) using PAUP*. Green, unambiguous placement/grouping; turquois, weakly 'rogue-ish', red, rogue taxa |
But even the Adams consensus tree (Fig. 2B) is more informative, and the (near) strict consensus network (only showing splits that occur in more than a single MPT) highlights where the equally parsimonious solutions agree and disagree, and which taxa act more ‘rogueish’ than others (Fig. 2C). Weighting and Bayesian inference naturally produce more resolved trees; but the question remains whether the overall higher to unambiguous branch support sufficiently reflects the signal in the character matrix.
Data sets of extinct organisms need neighbour-nets, to start with
The consensus network of the most (equally) parsimonious trees (MPT; Fig. 2C) informs us about equally valid topological alternatives and ‘rogueness’. Using the branch-length averaging option, we can visualize character support to some degree for the alternatives. But there is a quicker and more comprehensive alternative, when it comes to (tree-)incompatible signal.
The neighbour-net (Fig. 3) directly identifies potentially strong signals and ‘weak spots’. First, we can see that the outgroup taxa are not clustered, which is never good. Obviously, they are not too useful to infer an ingroup root (Madzia & Cau discuss the outgroup sampling bias). Only one of the outgrops, Pontosaurus, is placed closed to the Aigialosauridae, which collects the earliest diverging Mosasauroideae lineage (see Fig. 1). Their signals are likely to mess-up any tree inference (Fig. 2).
 |
| Fig. 3 The neighbour-net based on simple (Hamming) mean distances inferred from Madzia & Cau's matrix. Colouring as in Fig. 1 |
Trivial (data-wise) lineages are e.g. the Tylosaurinae, supported by a very long narrow branch— this lineage is characterised by high group coherence and distinctness to any other taxon/taxon group and will inevitably have high support and placed close (phylogenetically and absolute) to the Plioplate-carpinae (Figs 2, 3). The Mosasaurinae are equally well circumscribed, with only one putative member, Dallasaurus, being substantially apart from the rest, and bridging Mosasaurinae and Halisaurinae, their putative sisters. Hence, trees will favour splits rejecting the "Natantia" group unless Dallasaurus is excluded from the inference.
Species of the same genera are conspicuously grouped; this differs from Madzia & Cau’s trees, where Mosasaurus or Prognathodon species are collected in the same subtrees, but are “non-monophyletic”, i.e. do not form an exclusive clade. Based on the neighbour-net, the main reason may be terminal noise and resulting flat likelihood surfaces (hence, low posterior probabilities). The placement of the older members of the mosasaurs (classified as Tethysaurinae and Yaguarasaurinae) to each other, and the slightly older outgroup taxa, is clearly difficult with this matrix, even though there is no ambiguity, e.g. in the MPT sample (Fig. 2). Hence, the branch-lengths do not reflect synapomorphies or rarely shared apomorphies in this subtree, but instead shared convergences — a perfect phylogeny always generates a perfectly tree-like distance matrix.
Oddly placed taxa in the neighbour-net? Probably unrepresentative distances; and the quick fix
In contrast to trees, the network in Fig. 3 fails to resolve a likely position for one Prognathodon species: P. currii, and the large associated box indicates a data issue. The pairwise distances of the oddly placed P. currii and the probably misplaced Dolichosaurus, are poorly defined: both have zero-distances to non-similar taxa, but also to each other. But whereas Dolichosaurus differs from other members of Prognathodon by mean morphological distances (MD) of 0.5–1.0 (1.0 means it differs in all defined characters!), P. currii is much more similar to its congeners (MD = 0.17–0.27 and 0.46). Their other affinities also lie with strongly different taxon sets.
Their position in the neighbour-net is the result of a missing data artefact. Being just a 2-dimensional graph, such severe signal ambiguity cannot be resolved. Unrepresentative distances are the major (only) obstacle for neighbour-nets in the context of extinct groups. Trees are more decisive in such cases, when the few covered characters fit well the preferred tree's topology. By removing the outgroup taxa and P. currii, we can generate a neighbour-net (Fig. 4) in-line, and going beyond the Bayesian-tree-based groups suggested by Madzia & Cau (Fig. 1).
 |
| Fig. 4 Same data and method as shown in Fig. 3; four OTUs were excluded, the non-Mosasauroidea (outgroup) and the misplaced Prognathodon currii |
Using networks to define taxonomic groups
Just based on the neighbour-nets (Figs 3, 4), circumscription of genera and higher taxa can be discussed (assuming that morphology mirrors phylogeny). For instance, Mosasaurus can be kept as-is or can include Plotosaurus; whereas the Clidastes form a clearly distinct taxon (whether paraphyletic/ monophyletic or clade/grade may be impossible to decide, see Fig. 1). Including (all) Prognathodon in the Globidensini remains an option; Eremiasaurus may be included, too, or included in the likely sister clade, the Mosasaurini.
Dallasaurus is not only the oldest possible but clearly the most unique (primitive?) member of the Mosasaurinae, and the Halisaurinae likely represent their early diverged sister lineage. Treating Tylosaurinae and Plioplatecarpinae as reciprocally monophyletic sister lineages makes sense with respect to the older taxa and the co-eval Mosasaurinae-Halisaurinae lineage. The ancient forms are generally more similar to Plioplatecarpinae (+ Tylosaurinae) than to the Mosasaurinae and Halisaurinae lineages; but whether they should be included in the same systematic group ("Russellosaurina") cannot be judged based on the data matrix or the inferred trees (see also Figs 1, 2). Their topological attraction may be due to more shared primitive features (Hennig's ‘symplesiomorphies’), and the "Russellosaurina" could be a paraphyletic clade.
An interesting pronounced central edge bundle in the network in Fig. 4, which agrees well with Madzia & Cau's Bayesian consensus tree (Fig. 1), is the one separating all oldest, potentially more primitive taxa/lineages (> 90 Ma) from the later more diversified lineages (Mosasaurinae, Halisaurinae, Plioplatecarpinae, and Tylosaurinae). Regarding primitiveness vs. derivedness, an option to map characters on networks and extract alternative trees directly from the network would be handy (see also David’s 500th post).
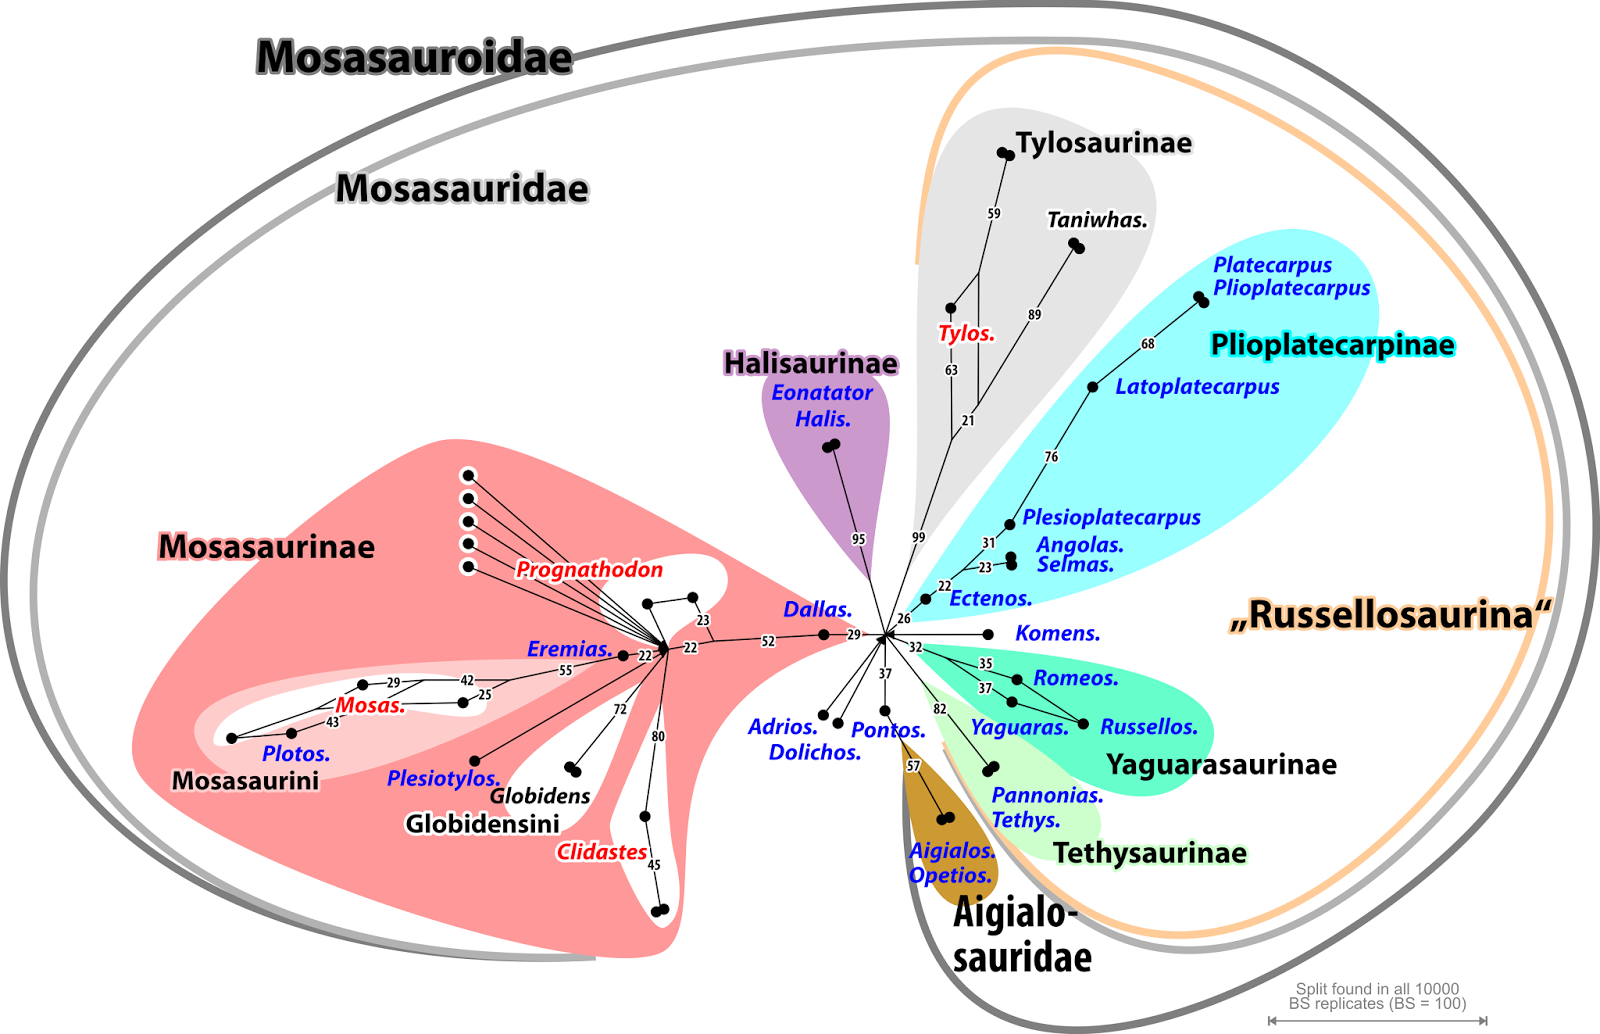 |
Fig. 5 Bootstrap (BS) support network based on 10,000 BS (pseudo)replicates optimised under parsimony. Splits are shown that occurred only in at least 20% of the BS replicates; trivial splits are collapsed. Some taxa have low, but unchallenged support, in other cases no preference at all is found (e.g. for the highest level bracketing taxa) or two alternatives compete with each other.
|
Also in the case of the mosasaurs: when we want to use phylogenetic trees as the sole (or main) basis for classification, rather than neighbour-nets (see my last post) and common sense backed up by EDA (e.g. Fig. 4; Bomfleur et al. 2017), the method of choice would be the support consensus networks based on parsimony (example provided in Fig. 5), least-squares, and/or likelihood bootstrapping pseudoreplicate samples. in addition to or instead of the Bayesian-inferred topologies sample. The posterior probabilities in Madzia & Cau’s tip-dated tree and Bayesian majority-rule consensus tree include values << 1.0, which already can be an indication of very strong signal conflict or just lack of discriminating signal (flat likelihood surfaces).
We should not be over-confident in PP, when the underlying data are not tree-like at all, as they too easily tilt towards one alternative (see also Zander 2004). The same holds for post-analysis character weighting, designed to eliminate (down-weigh) conflicting signals. While parsimony and distance methods are more easily affected by branching artefacts, probabilistic methods may struggle with flat likelihood surfaces. Thus, bootstrap support networks should be the first choice for ‘phylogenetic’ (by identifying Hennigian monophyla) or ‘cladistic’ (clade-based) classification as they show the robustness of the signal for the preferred and other topological alternatives, and can be generated under different optimality criteria. Having a certain support for a clade is nice, but one should always consider the support for alternatives, and consider how many characters support or oppose an alternative.
Morphological matrices need to be analysed using network approaches
Madzia & Cau’s study is methodologically interesting by providing a tip-dated Bayesian tree for an extinct group of organisms. A one-to-one comparison of their parsimony-BS support using different character and weighting schemes vs. Bayesian PP may be interesting, too — note the difference between the tip-dated tree and the majority rule consensus trees for several critical branches. However, following the current standard practice, no BS pseudoreplicate and Bayesian saved topologies samples were provided. Regarding the main objective, the identification of ‘weak spots’ to propose enhanced systematic groups, networks (Figs 2–5) would have been more informative and straightforward.
No matter what classification philosophy is applied, when we deal with morphological matrices of extinct groups of organisms, the first step should always be to explore the primary signal in the data before we infer trees using (highly) sophisticated methods, and interpret them — the latter may actually obscure ‘weak spots’ rather than identifying them. The quickest analyses are neighbour-nets, but watch out for odd pairwise distance patterns (easily visualised using heat maps)!
The second step is producing support consensus networks, for the fine-tuning and to decide on the most probable trees to explain the data. Regarding classification, we should ask ourselves whether we really want inevitably unstable clade-based classification systems (when dealing with extinct organisms), or robust ones that reflect the general data situation and include potentially or likely paraphyletic taxa (see e.g. Clidastes in Figs 2–5 and Madzia & Cau's trees, and their elaborate discussion of higher level taxa, which – to a good degree – could become superfluous when allowing paraphyletic taxa).
Links
All graphics, and some primary data files, are publicly available from figshare. An archive including all re-analysis files can be downloaded at www.palaeogrimm.org.
References
Bell GL (1997) A phylogenetic revision of North American and Adriatic Mosasauroidea. In: Callaway JM, and Nicholls EL, eds. Ancient Marine Reptiles. San Diego: Academic Press, pp. 293–332 [cited from Madzia & Cau 2017]
Bomfleur B, Grimm GW, McLoughlin S. 2017. The fossil Osmundales (Royal Ferns)—a phylogenetic network analysis, revised taxonomy, and evolutionary classification of anatomically preserved trunks and rhizomes. PeerJ 5:e3433. https://peerj.com/articles/3433/.
Madzia D, Cau A (2017) Inferring 'weak spots' in phylogenetic trees: application to mosasauroid nomenclature. PeerJ 5: e3782. https://peerj.com/articles/3782/.
Zander RH (2004) Minimal values of reliability of Bootstrap and Jackknife proportions, Decay index, and Bayesian posterior probability. PhyloInformatics 2: 1–13.


