Showing posts with label Phylogeny. Show all posts

Monday, November 18, 2019

Why the emporer has no clothes on – conflict or not?


In the final part of this series dissecting angiosperm gene trees (see: Why the emporer has no clothes on — part 1 and part 2), we will enter muddy ground. Using our example data set, we will try to make a call on whether or not there has been any (detectable) major reticulation in the deep branches of the angiosperm tree.

What triggers conflicting gene histories

Before we look at the data, it may be a good idea to set the scene using simple theoretical examples of what we may look at.


Our two genes, represented by circle and pentagon (could be multigene regions or entire genomes), both follow the same evolutionary history (the gray background tree). In the left lineage, we have a bit of incomplete lineage sorting, because the ancestor was polymorphic for the circles. In the right lineage, we have different fixation rates: the circles evolve faster than the pentagons. With molecular data we usually don't have the ancestors, making any inference straightforward; we only have the tips.


Because of incomplete lineage sorting and different fixation rates in the left and right lineages, the circle gene tree gets the phylogeny pretty wrong. The pentagon gene tree comes closer to the reality – we only infer two sister clades where there is a grade. (With real-world data, the branch support values could give one a clue that three of the inferred blue clades have a higher quality than the fourth supporting a pseudo-monophylum.) The circle and pentagon trees are largely incongruent despite sharing the same history; and we may infer a pseudo-hybrid (the first diverging lineage within the right clade).

Combining these data may allow us to infer a tree that fits the real tree much better. In the left clade the trivial pentagon signal can out-compete the misleading circle signal, and avoid the misplacement of the first diverging lineage of the right clade. In the right clade, the circle signal can help to correct for the pseudo-clade.

Now we can add a late reticulation, and re-infer the gene trees.


Because of the reticulation (the circles are biparentally inherited, the pentagons maternally), the gene trees are more congruent then in the example above (circle and pentagon get it a bit wrong in the left clade), except for the hybrid and its pseudo-hybrid parent. The gene conflict in placing the lineage cross (part of the left clade in the circle-based tree, part of the right clade in the pentagon tree) well reflects its hybrid origin.

Different histories of nuclear genes vs. plastid / mitochondrial genes?

The easiest way to catch reticulation is to compare trees based on plastid / mitochondrial data (maternally inherited) vs. nuclear data (biparentally inherited). If reticulation happened in the past, we can expect that the maternal and biparental genealogy diverge from each other (see part 2).

Strict Consensus network of the plastid (data from 3 protein-coding genes +1 partly coding gene region), mitochondrial (3 protein-coding genes) and nuclear trees (2 nrDNAs). The bold lines represent generally accepted phylogenetic splits (APG IV tree, see also Steven's comprehensive Angiosperm Phylogeny Website).

This network is much more box-like compared to what one would have expected based on the combined tree that can be inferred from the data (Part 1). But are we looking on largely decoupled histories?

This mess is hardly surprising. The combined tree is constrained by the plastid tree, specifically by the signal from the matK gene (Part 1), while the remaining plastid genes (from a different part of the plastome) fall into line. The mitochondrial tree combines genes that on their own inform poorly resolved trees riddled with branching artifacts (Part 2). The nuclear tree, on the other hand, combines the most and least divergent nuclear genes widely known. Because of this, they show topological conflict between each other.

18S-25S rDNA tanglegram. The branch numbers show each gene's bootstrap support (BS) deviating from the combined BS support for the respective branch (indicated by line thickness): green, increased BS support when combining both genes, red, decreased BS support.

However, they are part of the same multi-copy coding unit (the 35S nuclear rDNA) that has very particular evolutionary constraints, such as structural constraints, affected by completeness of concerted evolution and intra-genomic recombination. Polyploid grasses, for example, can have up to three different collections of 35S rDNA, reflecting four different evolutionary origins, being part of the A, B, C or D genomes. You end up with what is called a multi-labelled tree: the A, B, C and D-genome variants of the same taxon pop up (consistently) in different parts of the tree, and you can have recombinants. If we look into the 18S vs. 25S data, however, we find no consistent sequence patterns supporting the topological conflicts between the two trees, or examples for recombination.

As in our theoretical example, each of the trees has certain strengths, and its own set of weaknesses, some of which can be overcome when combining the data (eg. branches with increased combined support in the 18S-25S tanglegram)

Bootstrap (BS) Consensus networks for the combined cp (upper left), mt (upper right), nc (lower left) and full data (lower right). Branches without numbers: BS = 100. Splits conflicting with those present based on the full data highlighted by red font (all with BS < 100).

In contrast to the boxy network appearance and the substantial conflict between the single gene trees (Part 2), most of the relationships (eg. the major clade roots but also many intra-clade relationships) receive high or unambiguous support in all three trees*. Aside from the disparate signals, the data seem to converge on a coalescent. If the genomes had different histories, they wouldn't converge so easily. Also, we would expect to see more consistent conflict between the "genome" trees than between the single-gene trees of the same genome, since the nuclear rDNA is biparentally inherited while the plastid and mitochondrial DNAs are passed on via the mothers only. Many of the angiosperms in our data reproduce sexually.

So far, no conclusive evidence for reticulation

Mere gene-tree incongruence is a poor basis to conclude about decoupled gene histories. We need to dig for sequence-based evidence for reticulation and recombination. For instance, we might find a clearly derived sequence pattern exclusive to the right clade in a member of the left clade.

The importance of rare genomic changes when interpreting conflicting gene trees. The left and right clades obtained a unique and conserved gene or sequence feature before they diversified. The hybrid is the only taxon showing both.

This is where the Walker et al. (2019) and Sullivan et al. (2017) studies seem to fall short — they don't give any example, gene, gene region, or recognizable lineage-diagnostic sequence pattern that could be used as direct evidence for decoupled gene histories and/or reticulation.

For my data set, I cannot pinpoint such evidence either. All high(er)-supported conflict seems to be related to lineage sorting and data/signal issues, the inability of certain gene regions to resolve relationships in parts of the angiosperm tree, or falling prey to (more local than global) long-branch attraction. When looking at the sequences, there's no reason to question, for example, the assumed monophyly of the main lineages and orders, in spite of the topological conflict we face when analyzing these data. If there was reticulation between the ancestors of angiosperm lineages, or later on between the already formed lineages, it left no obvious imprint in the data.

Thus, after having investigated aspects of the seeming conflict by going back to the data (checking highly divergent and conserved sequence patterns, tabulating the partly competing BS support of the single genes, and minus-one gene analyses), I did not hesitate to combine these data and use a Bayesian total-evidence dating procedure. (We never published the results because mid-Cretaceaous angiosperm fossils have much too derived morphologies for total evidence dating; when left unconstrained, MrBayes optimized towards an angiosperm root age of 4.5 Ba, which was the in-built maximum).

A total-evidence Bayes tree based on the full data set. Stars indicate the position of fossil taxa (mid-Cretaceaous). Note their relative long terminal branches, a situation total-evidence dating cannot handle. The matrix can be found at figshare: A basic total evidence matrix for basal angiosperms — combining Soltis et al (2011) with Doyle & Endress (2010).

An example for actual reticulation resulting in gene tree conflict

Working at the coal-face of evolution, I have encountered examples of apparently real reticulation (when analysing biparentally inherited nuclear data). The most compelling was probably the ancient relictual genotypes and pseudogenes that point towards ancient reticulation in the widely known plane trees, Platanus. Platanus subgenus Platanus (which includes all but one species, P. kerrii, a relict of a distant lineage growing in tropical-hot subtropical lowland forests of North Vietnam) falls into two main lineages characterized by unique sets of genotypes, the ANA clade (Atlantic-facing North and Mesoamerica) and the PNA-E clade (NW. Mexico, California and Mediterranean).

Haplo/-genotypic composition of Platanus (Grimm & Denk, Taxon, 2010, ES2 [PDF]). Platanus kerrii represent the sole surviving relative within the Platanaceae (genetically very distinct), an old lineage of angiosperm trees (going back deep into the Cretaceous). Their next kin today are, according to angiosperm molecular trees, the enigmatic Proteaceae, a Gondwanan relict (represented in our angiosperm data by Petrophile). For an even more comprehensive genotypic study that also covers plastid markers check out De Castro et al., Ann. Bot., 2013 [open access])

Individuals in the contact zone between species of the two main lineages (including hybrids) can be heterozygotic / polymorphic for at least one of the sequenced nuclear regions, so that identification of recent hybrids is straightforward. Beyond this, genetically inconspicious members of the ANA clade may show ITS pseudogenes from the PNA-E clade (stippled line in the figures above and below). Furthermore, two of the ANA clade species show (predominately), a PNA-E LEAFY genotype — P. palmeri (pa) and P. rzedowskii (rz), which grow closest to the populations of the PNA-E clade. However, this is not the genotype found in the close-by American PNA-E species (ra, ge), which is one that's sequence is phylogenetically closer to the Mediterranean species, P. orientalis (or), on the other side of the globe.

Overlay of the LEAFY, 5S-IGS and ITS histories in Platanus. This doodle is based on tree- and network-inferences coupled with PCR-RFLP-based genotyping and in-depth analysis of mutation patterns in length-polymorphic sequence regions (Grimm & Denk 2010, ES1). P. x hispanica is the well-known ornamental alley/park tree, the 'London plane'. A cultivated historical hybrid (mid 18th century) of the most hardy North American plane, P. occidentalis, and the frost-vulnerable Mediterranean plane, P. orientalis. In the Mediterranean, due to frequent backcrossing, one can find morphologically mixed individuals showing only the P. orientalis genotypes or homogenous (American or European) type individuals showing occidenatlis and orientalis genotypes (see eg. Pilotti et al., Euphytica, 2009) 

Further reading

An animal example, of seemingly incongruent single-gene trees that may well be the product of a largely shared evolutionary history, is the autosomal intron data compiled for bears by Kutschera et al. (2014. Bears in a forest of gene trees: Phylogenetic inference is complicated by incomplete lineage sorting and gene flow. Mol. Biol. Evol. 31:2004–2017). Rather than a "forest of trees", each gene tree is poorly resolved but, when combined, allows inferring a phylogeny that matches quite well the parental genealogy based on Y-chromosome data, both in strong conflict with the maternal genealogy inferred from mitochondriomes (see Part 2).

In Supplement File S6 [PDF] of Grímsson et al. (2018, Grana 57:16–116), I outline how ambiguous signal from combined gene regions relate to the poor support of critical branches in the Loranthaceae tree; see also the related posts: Using consensus networks to understand poor roots and Trivial but illogical – reconstructing the biogeographic history of the Loranthaceae (again). Some gene-tree conflicts are possibly linked to different histories (nuclear vs. chloroplast data), while others are a mix of insufficient signal and missing data (between chloroplast genes).

In a previous post (All solved a decade ago: the asterisk branch in the Fagales phylogeny), I give another example using an old Fagales matrix, which resulted in a tree that, even today, is the gold standard of Fagales phylogeny. The matrix combines a highly conserved nuclear gene (18S) conflicting with the plastid genes and complemented by an entirely uninformative mitochondrial gene (matR) to provide a "tree based on all three genomes". Also in this case the three-genome tree is essentially the matK tree.


* That doesn't mean that all highly supported, unconflicted relationships must be true. Note that just by combining a few genes, we obtain a near-unambiguous support for the split between Mesangiosperms and the ANA-grade + gymnosperms, one of the splits defining the root and "basal" part of the angiosperm tree. The outgroup-inferred root is well fixed. Even when using nuclear data, despite the fact that the 18S signal (the one showing the least ingroup-outgroup genetic distance) doesn't support such a root but the 25S does (see part 2), being more divergent and prone to ingroup-outgroup long branch attraction (LBA). That we have LBA issues with the data is obvious from a tiny detail: Ginkgo is supported with BS > 70 as sister of Podocarpus, which is wrong, based on all we know about gymnosperms,(see also Earle's gymnosperm database and literature cited therein). The likely correct split, Ginkgo as sister to Cycas, is present in the nc tree, but represents a much less supported alternative (BS <= 25). It is also obvious when one looks at the alignment(s): Cycas and Ginkgo share some potential genetic 'synapomorphies' in the low-divergent, generally conserved regions (eg. 18S, stem-regions of 25S), but there are essentially none for Gingko + Podocarpus.

Monday, June 3, 2019

A phylogenetic network outside science


I have written before about the presentation of historical information using the pictorial representation of a phylogeny (eg. Phylogenetic networks outside science; Another phylogenetic network outside science). These diagrams are often representations of the evolutionary history of human artifacts, and so a phylogeny is quite appropriate. They are of interest because:
  • they are usually hybridization networks, rather than divergent trees, because the artifact ideas involve horizontal transfer (ideas added) and recombination (ideas replaced);
  • they are often not time consistent, because ideas can leap forward in time, so that the reticulations do not connect contemporary artifacts (see Time inconsistency in evolutionary networks); and
  • they are sometimes drawn badly, in the sense that the diagram does not reflect the history in a consistent way.
The latter point often involves poor indication of the time direction (see Direction is important when showing history), or involves subdividing the network into a set of linearized trees.

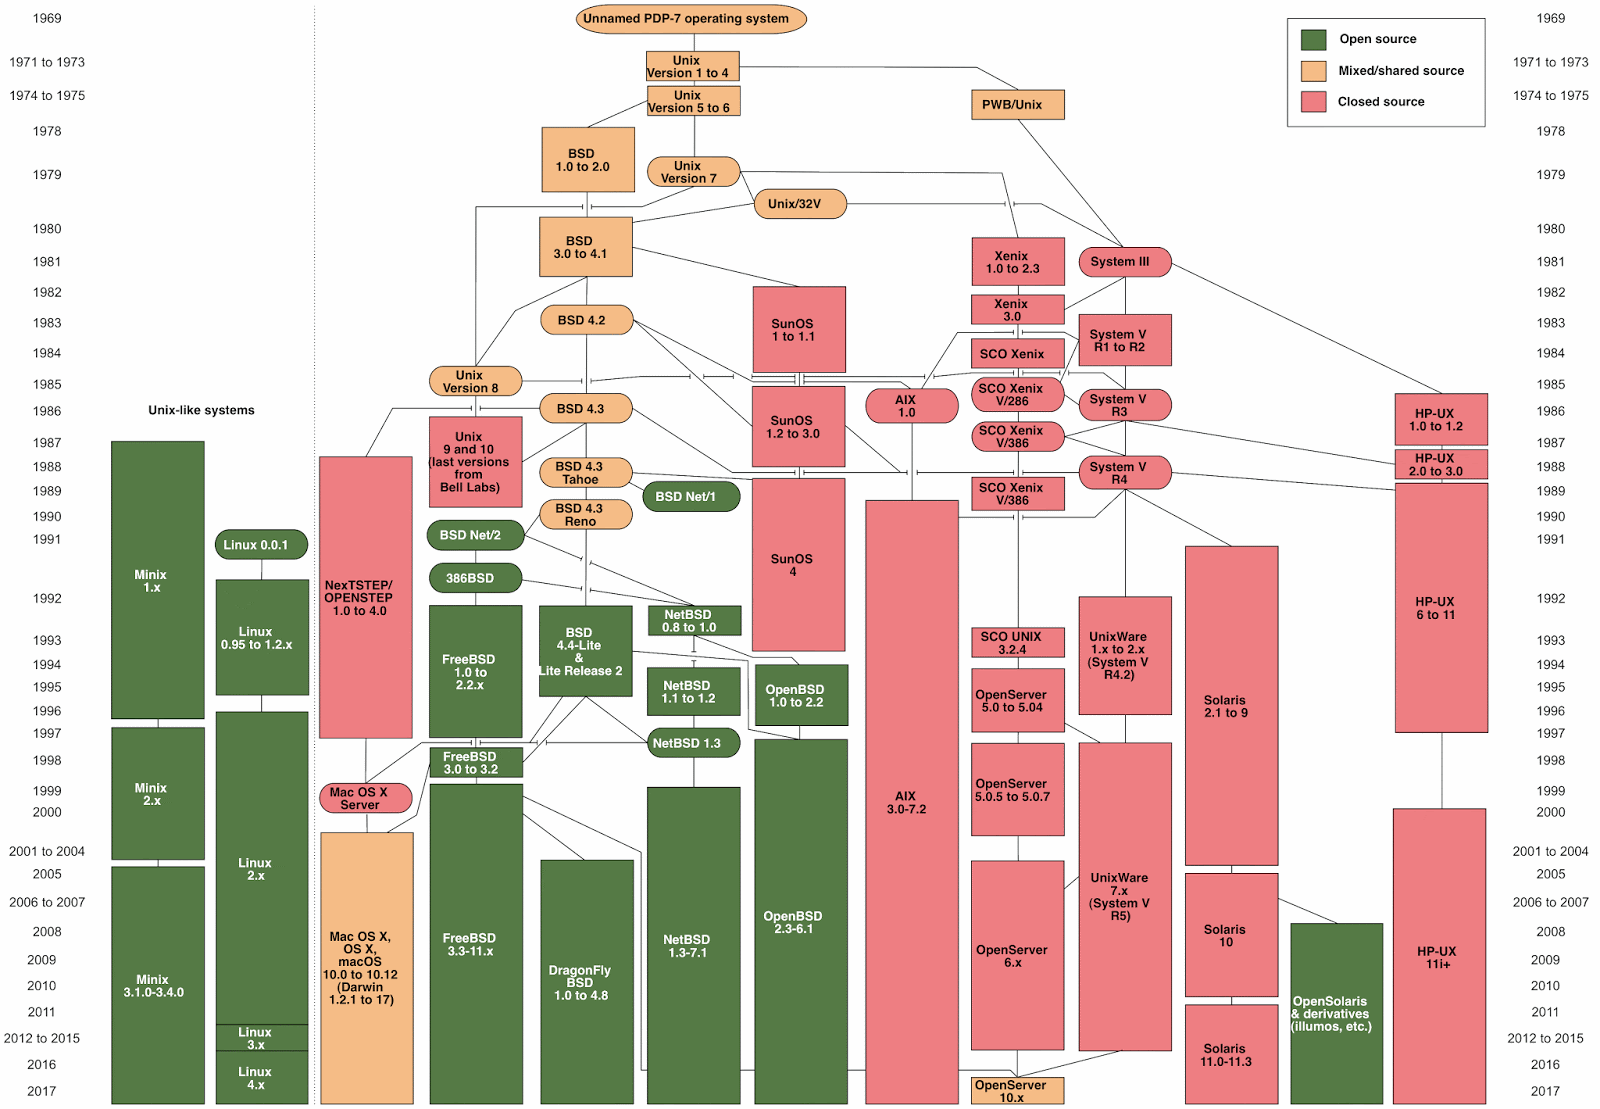
One particularly noteworthy example that I have previously discussed is of the GNU/Linux Distribution Timeline, which illustrates the complex history of the computer operating system. The problems with this diagram as a phylogeny are discussed in the blog post section History of Linux distributions.

In this new post I will simply point out that there is a more acceptable diagram, showing the key Unix and Unix-like operating systems. I have reproduced a copy of it below.

Click to enlarge.

This version of the information correctly shows the history as a network, not a series of linearized trees (each with a central axis). It also draws the reticulations in an informative manner, rather than having them be merely artistic fancies.

It is good to know that phylogenetic diagrams can be drawn well, even outside biology and linguistics.

Monday, May 6, 2019

Corals — a new metaphor for phylogenetic diagrams


A year ago I mentioned a published discussion of the different branching diagrams that have been used for phylogenetic relationships (Tree metaphors and mathematical trees). If we consider the form of the relationship and whether time is involved, we get the following four possible diagram types:


Most current phylogenetic diagrams claim to show sister-group relationships (which means that ancestors are inferred only), with a time-order to the branching sequence. There is a broad range of diagram types in use, both mathematical and metaphorical. For example, the top four in this next diagram are mathematical and the bottom four are metaphorical variants of the above 2x2 table:


The connection between these different diagrams has both conceptual and practical problems, although these seem to be overlooked by most practitioners. This issue as been addressed by János Podani in a paper that is now online:
The Coral of Life. Evolutionary Biology (2019).
To quote from the Abstract:
The Tree of Life (ToL) has been of central importance in the biological sciences, usually understood as a model or a metaphor, and portrayed in various graphical forms to summarize the history of life as a single diagram. If it is seen as a mathematical construct — a rooted graph theoretical tree or, as more recently viewed, a directed network, the Network of Life (NoL) — then its proper visualization is not feasible, for both epistemological and technical reasons. As an overview included in this study demonstrates, published ToLs and NoLs are extremely diverse in appearance and content ... Metaphorical trees are even less useful for the purpose, because ramification is the only property of botanical trees that may be interpreted in an evolutionary or phylogenetic context. This paper argues that corals, as suggested by Darwin in his early notebooks, are superior to trees as metaphors, and may also be used as mathematical models. A coral diagram is useful for portraying past and present life because it is suitable: (1) to illustrate bifurcations and anastomoses, (2) to depict species richness of taxa proportionately, (3) to show chronology, extinct taxa and major evolutionary innovations, (4) to express taxonomic continuity, (5) to expand particulars due to its self-similarity, and (6) to accommodate a genealogy-based, rank-free classification.
It is worth checking out this paper, even if only for the new Coral of Life diagram that is presented in its Figure 3, which synthesizes much of our current knowledge.

Monday, January 21, 2019

A question about coalescent-based species phylogenies


This may be a naive question; but as I am now semi-retired, so I can now ask it without professional embarrassment.

It is common when constructing species phylogenies (both trees or networks) to use a model that takes into consideration multiple replacements of characters through evolutionary time. If the states of any given character have been modified multiple times, then the currently observed differences in that character between taxa will not accurately reflect their evolutionary history.

For example, we "correct for multiple substitutions" when using DNA/RNA sequence data. We do this because, with only four character states, the probability that undetectable multiple substitutions have occurred increases considerably through evolutionary time. So, we have developed any number of sophisticated models for addressing this issue, such as JC and GTR; and it is unusual to see a published paper with a species phylogeny that does not use one of them.

This leads to a question about population phylogenies. In this case, the use of the coalescent model is prevalent. It allows the calculation of various population parameters, based on viewing phylogenies backwards through time. For the purpose of phylogenetics, the key calculation is the coalescence time of each pair of lineages, although population size is also of some interest.

The coalescent model is based on a set of assumptions, of course. Indeed, it is based on the Fisher-Wright model of population genetics. This is an infinite-sites model, meaning that it assumes that multiple replacements of characters do not occur during the evolution of the populations. That is, if the genetic sequences are infinitely long then the probability of multiple substitutions is 1 / infinity = zero.

This, then, is my question: Can we really assume that multiple substitutions never occur, in one part of the analysis, and assume that they are so common that we need to adjust for them, in another part of the same analysis?

I have not found this issue addressed either in the published literature or on the internet. Indeed, most people I have spoken to did not even realize that the coalescent is ultimately based on an infinite-sites model. So, for me at least, this is an interesting question.

Monday, September 17, 2018

Getting the wrong tree when reticulations are ignored


One issue that has long intrigued me is what happens when someone constructs a phylogenetic tree under circumstances where there are reticulate evolutionary events in the actual (ie. true) phylogeny itself. That is, a network is required to accurately represent the phylogeny, but a tree is used as the model, instead. How accurate is the tree?

By this, I mean that, if the phylogeny can be thought of as a "tree with reticulations", do we simply get that tree but miss the reticulations, or do we get a different (ie. wrong) tree?


Sometimes, people refer to this situation as having a "backbone tree" — the phylogeny is basically tree-like, but there are a few extra branches, perhaps representing occasional hybridizations or horizontal gene transfers. The phylogenetic tree can then be treated as a close approximation to the true phylogeny, representing the diversification events but not the (rarer) reticulation events.

I have argued against this approach (2014. Systematic Biology 63: 628-638.). Instead of seeing a network as a generalization of a tree, we should see a tree as a simplification of a network. If we do this, then we would construct a network every time; and sometimes that network would be a tree, because there are no reticulation events in the phylogeny. It cannot work the other way around, because we can never get a network if all we ask for is a tree!

Presumably, if there are no reticulations then we should get the same answer (phylogenetic tree) irrespective of whether we simply construct a tree or instead construct a network that turns out to be a tree. But what about the "backbone tree" situation? Here, it has always seemed to me to be possible that we do not get the same tree. If this is so, then constructing a tree and then adding a few reticulations to it (as is often done in the literature) would not work — we would be adding reticulations to the wrong backbone tree.

There are two possible ways in which we can get the wrong backbone tree: the topology might be incorrect, or the branch-lengths might be incorrect (or both). For example, if there are true reticulations and yet we do not include them in our model, I have argued that the branches will be too short (2014. Systematic Biology 63: 847-849.) — two taxa will be genetically similar because of the reticulation events, but the tree-building algorithm can only make them similar on the tree by shortening the branches (not by adding a reticulation).

Fortunately, for at least one tree-building model Luay Nakhleh and his group have now done some simulations to answer my questions. You may not yet have noticed their results, because they are not necessarily in the most obvious place; so I will highlight them here. The analyses involve the Multispecies Coalescent (MSC) model, which accounts for incomplete lineage sorting during the tree-like part of evolution, as compared to the Multispecies Network Coalescent (MSNC) which adds reticulations (eg hybridization) to the model.

1.
Dingqiao Wen, Yun Yu, Matthew W. Hahn, Luay Nakhleh (2016) Reticulate evolutionary history and extensive introgression in mosquito species revealed by phylogenetic network analysis. Molecular Ecology 25: 2361-2372.

This paper compares a tree-based analysis (construct a tree first then add reticulations) with a network-based analysis (construct a network) for an empirical genomic dataset. The two results differ.

2.
Dingqiao Wen, Luay Nakhleh (2018) Coestimating reticulate phylogenies and gene trees from multilocus sequence data. Systematic Biology 67: 439-457.

Tucked away in the Supplementary Information are the results of a set of simulations comparing the MSC (using *Beast) and the MSNC (using PhyloNet), with (section 3) and without (section 2) reticulations. The basic conclusion is that, in the presence of reticulation, tree-based methods either get the tree completely wrong, or they get the tree topology right but the branch lengths are "forced" to be very short. A summary of the latter result is shown in the figure above. In the absence of reticulation, both methods produce the same tree.

3.
R.A. Leo Elworth, Huw A. Ogilvie, Jiafan Zhu, and Luay Nakhleh (ms.) Advances in computational methods for phylogenetic networks in the presence of hybridization. (chapter for a forthcoming book]

A summary of the group's work to date. Section 6.3 summarizes the results from the paper 2.

Monday, February 12, 2018

Tree metaphors and mathematical trees


We have had quite a few blog posts about the early metaphors used for genealogical (and other) relationships, whether they be for biology, linguistics or stemmatology. These early metaphors tended to be about trees, either in a literal sense or as a stick diagram of some sort, although we have tried to cover all of the early genealogical networks, as well.

One of Haeckel's oaks

However, this situation does create some potential confusion, because the concept of a genealogical (or phylogentic) tree in the modern world is very much based on the mathematical concept of a tree, which is a graph-theoretical construction. This was clearly not the intention of most of the early authors, especially those writing before Arthur Cayley introduced the mathematical concept (in 1857).

The mathematical version of a tree is a line graph, in which nodes are connected by edges. The edges must be directed if the graph is to represent evolutionary history (ie. the edges point away from the root); and it must be acyclic (or else a descendant could be its own ancestor). The leaf nodes are usually (observed) contemporary taxa, and the internal nodes are (inferred) ancestors. Note that this definition can be applied to both bifurcating trees and to reticulating networks.

This construction is valuable for computational purposes, because we can construct a mathematically optimal tree, which biologists can then use as a starting point for representing the hypothesized genealogy. However, it is not necessarily valuable as a metaphor, which was the purpose of most of the early authors.

There is thus a potential difficulty for modern reads to interpret the older diagrams; and it seems likely, in turn, that the authors of many of the older diagrams would be somewhat befuddled by the modern mathematical restrictions. Sometimes the metaphor and the mathematics will agree, and sometimes they won't.

Branching silhouettes

This issue has been addressed by János Podani in two complementary papers:
  • Tree thinking, time and topology: comments on the interpretation of tree diagrams in evolutionary / phylogenetic systematics. Cladistics 29: 315-327 (2013).
  • Different from trees, more than metaphors: branching silhouettes — corals, cacti, and the oaks. Systematic Biology 66: 737-753 (2017).
He calls the tree metaphors "branching silhouettes", to distinguish them from the mathematical trees. His basic point is this:
There has long been ambiguity in the use of the term tree in phylogenetic systematics, which is a continuous source of misinterpretation of evolutionary relationships. The basic problem is that while many trees with phylogenetic or evolutionary relevance ... are consistent with graph theory, tree-like visualization of phylogeny may also be done via other types of graphics, especially botanical (or literal) tree drawings. As a consequence, the meaning of such diagrams is not always clear: a given picture may have multiple interpretations in its different parts, and two figures that look similar may actually carry quite different information.
Podani resolves the ambiguity by recognizing two fundamental characteristics that any tree diagram will contain: (1) it may show either ancestor-descendant relationships or sister-group relationships; and (2) a time order may be important or it may be disregarded. This leads to a 2x2 representation illustrating the four basic types of "trees" that have been used in phylogenetics.

Podani's tree-metaphor classification

He gives the four types of branching silhouettes tongue-twisting, but appropriate, names.

The diachronous diagrams are "classic" evolutionary trees with a time dimension, which thus have ancestors as internal nodes and contemporary organisms as the leaves. The achronous diagrams are similar, but they allow descendants to arise from contemporary taxa — they are thus the classic "grade" trees showing morphological advancement, which thus allow paraphyletic ancestral groups. The synchronous diagrams are the modern cladograms, with no observed ancestors (but maybe inferred ones at the internal nodes). The asynchronous diagrams are similar, but they can have ancestors as leaves (eg. "pattern" cladograms of ancestors and descendants together).

Podani also gives these four branching silhouettes colloquial names. Charles Darwin is often credited with the tree metaphor, but in the Origin of Species he explicitly acknowledges predecessors, although he does not actually name them (see Naudin, Wallace and Darwin — the tree idea). In his own notebooks, his first metaphor is actually a coral (see Charles Darwin's unpublished tree sketches), and this is the name that Podani recommends for the classic evolutionary trees.

He names the grade trees as cactus, named after the common epithet for the diagram used by Charles Bessey (in 1915) to illustrate plant relationships (see the image below). Furthermore, he recommends oak for the two variants of cladograms, as this is a common epithet for some of the diagrams drawn by Ernst Haeckel (see Who published the first phylogenetic tree?, plus the diagram at the top of this post).

Bessey's cactus

Finally, Podani's work does raise an interesting question. Modern (cladistic) methods of phylogenetics are designed to work with synchronous trees (ie. no observed ancestors). To what extent do these methods work if you try to put fossils into the dataset, which are potential ancestors? After all, this would make the result an asynchronous tree, instead of a synchronous one.

Tuesday, October 24, 2017

Let's distinguish between Hennig and Cladistics


There are theoretically an infinite number of ways to mathematically analyze any set of data, and yet it is unlikely that all (or even most) of these will have any relevance to a study of biology. In this sense, the philosophy of phylogenetic analysis needs to show that there is a strong basis for treating any particular mathematical analysis as having biological relevance. This is a point that I have discussed before: Is there a philosophy of phylogenetic networks?

Willi Hennig clearly has some role to play here. However, his ideas are often treated as being solely related to one particular form of phylogenetic analysis — cladistics. In this post I will point out that his work has a much greater relevance than that — he provides a crucial logical step that applies to all phylogenetic inference.

The steps of phylogenetic inference are shown in the first figure, which is taken from my earlier post. The first step is a mathematical inference from character data to tree/network; the second step is a logical inference that the mathematical summary resulting from the first step has some biological relevance; and the third step is a practical inference that the biological summary applies to whole organisms as well as to their characters.

The logic of phylogeny reconstruction

Summary

Hennig's concept of "shared innovations" (which he called synapomorphies) is the only thing that allows us to use the mathematical phylogenetics in the pursuit of genealogical history. Without this concept, the mathematics could just produce something like the arithmetic mean, a mathematical concept with no connection to real objects (unlike the median or mode, which will always be real). The idea of shared innovations is what leads us to believe that the mathematical summary (whether tree or network) might actually also be a close approximation to the real thing. This is a separate concept from cladistics, which is simply a mathematical algorithm based on a particular optimality criterion (parsimony), just like maximum likelihood or bayesian approaches. So, shared innovations underlie the use of both parsimony, likelihood and distance methods — Willi Hennig (and, before him, Karl Brugmann in linguistics) is relevant no matter what algorithm we use.

Mathematical analyses

If they are to represent genealogical history, then all trees and networks in phylogenetics will be directed acyclic graphs (DAGs), mathematically. There are many ways to produce a DAG, some of which have had varying degrees of popularity in phylogenetics, and some of which have not been used at all.

To produce an acyclic line graph (in which nodes are connected by edges), we can start with character data or distance data. We can then use various optimality criteria to choose among the many graphs that could apply to the data, such as parsimony (usually ssociated with cladistics) and likelihood (either as maximum likelihood or integrated likelihood). We can also ensure that the graph is directed (ie. the edges have arrows), by choosing a root location, either directly as part of the analysis or a posteriori by specifying an outgroup.

All of these approaches are mathematically valid, as are a number of others. They all provide a mathematical summary of the data. This is step one of the phylogenetic inference, as illustrated above.

But what of step two? Biologists need a summary of the data that has biological relevance, as well, not just mathematical relevance. This has long been a thorn in the side of biologists — just because they can perform a particular mathematical calculation does not automatically mean that the calculation is relevant to their biological goal.

Consider the simplest mathematics of all — calculating the central location of a set of data. There are many ways to do this, mathematically — indeed, there are technically an infinite number of ways. These include the mode, the median, the arithmetic mean, the geometric mean, and the harmonic mean. All of these are mathematically valid, but do any of them produce a central location that describes biology?

The mode does, because it is the most common observation in the dataset. The median usually does, because it is the "middle" observation in the dataset. But what of the various means? There is no necessary reason for them to describe biology, although they are perfectly valid mathematics.

For instance, the modal number of children in modern families is 2, meaning that more families have this number than any other number of children. The median number is also 2, meaning that half of the families have 2 or fewer children and half of the families have 2 or more. So, these mathematical summaries are also descriptions of real families. But the means are not. For example, the arithmetic mean number of children is 2.2, which does not describe any real family. If you ever find a family with 2.2 children, then you should probably call the police, to investigate!

Mathematically valid data summaries have a lot of relevance, but they do not necessarily describe biological concepts. I can use the mean number of children per local family to estimate the number of schools that I might need in that area, but I cannot use it to describe the families themselves. This is a classic case of "horses for courses".

Hennig

So, in phylogenetics we need some piece of logic that says that we can expect our DAG (a mathematical concept) to be a representation of a genealogy (a biological concept). Our genealogical estimate may still be wrong (and indeed it probably will be, in some way!), but that is a separate issue. The DAG needs to a reasonable representation, not a correct one. Correctness needs to be a result of our data, not our mathematics.

This is where Willi Hennig comes in. Hennig's ideas, and the ideas derived from them, are illustrated in the second figure.


Hennig explicitly noted that characters have a genealogical polarity, with ancestral states being modified into derived states through evolutionary time. Furthermore, he noted that it is only the derived states that are of relevance to studying evolutionary history — the sharing of derived character states reveals evolutionary history, but shared ancestral states tells us nothing.

We have done two things with these Hennigian ideas. Some people have been interested in classification, for which the concept of monophyly is relevant, and others have been interested in reconstructing the genealogies, rather than simply interpreting them.

Phylogenetics

Reconstructing a tree-like phylogenetic history is conceptually straightforward, although it took a long time for someone (Hennig 1966) to explain the most appropriate approach. Interestingly, the study of historical linguistics has developed the same methodology (Platnick and Cameron 1977; Atkinson and Gray 2005), thus independently arriving at exactly the same solution to what is, in effect, exactly the same problem. From this point of view, the logical inference itself is uncontroversial; and its generic nature means that it can be used for any objects with characteristics that can be identified and measured, and that follow a history of descent with modification. I will, however, discuss this in terms of biology — you can make the leap to other objects yourself.

The objective is to infer the ancestors of the contemporary organisms, and the ancestors of those ancestors, etc., all the way back to the most recent common ancestor of the group of organisms being studied. Ancestors can be inferred because the organisms share unique characteristics (shared innovations, or shared derived character states. That is, they have features that they hold in common and that are not possessed by any other organisms. The simplest explanation for this observation is that the features are shared because they were inherited from an ancestor. The ancestor acquired a set of heritable (i.e. genetically controlled) characteristics, and passed those characteristics on to its offspring. We observe the offspring, note their shared characteristics, and thus infer the existence of the unobserved ancestor(s). If we collect a number of such observations, what we often find is that they form a set of nested groupings of the organisms.

Hennig, in particular, was interested in the interpretation of phylogenetic trees, rather than their reconstruction. He did this interpretation in terms of monophyletic groups (also called clades), each of which consists of an ancestor and all of its descendants. These are natural groups in terms of their evolutionary history, whereas other types of groups (eg. paraphyletic, polyphyletic) are not. So, a phylogenetic tree consists of a set of nested clades, which are the groups that are represented and given names in formal taxonomic schemes.

For phylogenetic trees, there is thus a rationale for treating a tree diagram as a representation of evolutionary history. For example, in a study of a set of gene sequences, first we produce a mathematical summary of the data based on a quantitative model. We then infer that this summary represents the gene history, based on the Hennigian logic that the patterns are formed from a nested series of shared innovations (this is a logical inference about the biology being represented by the mathematical summary). We then infer that this gene history represents the organismal history, based on the practical observation that gene changes usually track changes in the organisms in which they occur (ie. a pragmatic inference).

Mis-interpretations of Hennig

What I have said above has lead to various mis-interpretations of Hennig's role in phylogenetics.

First, he did not propose any specific method for producing a phylogenetic tree (or network). He was concerned about the logic of the diagram. not how to get it in the first place. He distinguished shared derived character states, or shard innovations, (he called them synapomorphies) from shared ancestral states (symplesiomorphies), and noted that only the former are relevant for phylogenies. So, distance methods will also work in phylogenetics provided the distances are based on homologous apomorphic features. If they are not so based, then they are simply mathematical constructions, which may or may not represent anything to do with phylogeny. Distances estimated from plesiomorphic features can be used to construct a tree, obviously, but there is no reason to expect that tree to represent a phylogeny.

Second, parsimony analysis was developed independently of Hennig, by people such as Farris, Nelson and Platnick. This came to be called cladistics, intended by Ernst Mayr to be a derogatory term for the new form of analysis. The fact that the Willi Hennig Society is associated exclusively with cladistics has nothing to do with Hennig himself, or with the logic of his approach to phylogenetics. You need to clearly distinguish between Hennig and Cladistics!

Third, Hennig was more interested in classification than he was in phylogeny reconstruction. This seems to cause confusion for gene jockeys and linguists, in particular, who often associate phylogenetics solely with classification (see, for example, Felsenstein 2004, chapter 10). Sure, Hennig was primarily interested in the interpretation of phylogenies, rather than their construction. However, that was simply a personal point of view. The logic of his work transcends his own personal interests. Without him, no genealogical reconstruction makes logical sense, in genetics or linguistics. Mathematical methods for summarizing data were developed independently in genetics and linguistics, just as they were in other areas of biology and also in stemmatology. However, without the concept of shared innovations, these methods remain mathematical summaries, not estimates of genealogies.

Finally, Hennig's work was not original, being naturally a synthesis of much previous work. In biology, the work of Walter Zimmerman is frequently noted (eg. Donoghue & Kadereit 1992), and in linguistics the work of Karl Brugmann is obviously important (see Mattis' post Arguments from authority, and the Cladistic Ghost, in historical linguistics). Sometimes, wheels have to be re-invented many times before the general populace comes to realize just how important they are.

References

Atkinson QD, Gray RD (2005) Curious parallels and curious connections — phylogenetic thinking in biology and historical linguistics. Systematic Biology 54: 513-526.

Donoghue MJ, Kadereit W (1992) Walter Zimmermann and the growth of phylogenetic theory. Systematic Biology 41: 74-85.

Felsenstain J (2004) Inferring Phylogenies. Sinauer Associates, Sunderland MA.

Hennig W (1966) Phylogenetic Systematics. University of Illinois Press, Urbana IL. [Translated by DD Davis and R Zangerl from W. Hennig 1950. Grundzüge einer Theorie der Phylogenetischen Systematik. Deutscher Zentralverlag, Berlin.]

Platnick NI, Cameron HD (1977) Cladistic methods in textual, linguistic, and phylogenetic analysis. Systematic Zoology 26: 380-385.

Tuesday, March 21, 2017

Computer viruses and phylogenetic networks


I have written before about the Phylogenetics of computer viruses. This is an example of the use of phylogenetics as a metaphor for the history of non-biological objects. By analogy, computer viruses and other malware can be seen to be phylogenetically related, because new viruses are usually generated using existing malicious computer code — that is, one virus "begets" another virus due to changes in its intrinsic attributes. In this sense the analogy is helpful, although there is no actual copying of anything resembling a genome — this is phenotype evolution not genotype evolution.

Furthermore, the model of historical change in computer viruses is often the same as that for biological viruses — recombination rather than substitution. That is, like real viruses, new computer viruses are often created by recombining chunks of functional information from pre-existing viruses, rather than by an accumulation of small changes. Coherent subsets of the current computer code are combined to form the new programs.


From this perspective, it is unexpected that the principal phylogenetic model in the study of computer viruses has been a tree rather than a network — a recombinational history requires a network representation, not a tree, and thus malware evolution is not tree-like. As noted by Liu et al. (2016): "Although tree-based models are the mainstream direction, they are not suited to represent the reticulation events which have happened in malware generation."

In my previous (2014) post, I noted only two known papers that used a network rather than a tree to represent malware evolution:
  • Goldberg et al. (1996) analyzed their data using what they call a phyloDAG, which is a directed network that can have multiple roots (it appears to be a type of minimum-spanning network; described in more detail in Phylogenetics of computer viruses);
  • Khoo & Lió (2011) used splits graphs rather than unrooted trees to display their data, although they did not specify the algorithm for producing their networks.
Unfortunately, malware researchers have continued to pursue the idea that a phylogeny is simply a form of classification, and have therefore stuck to the idea of producing a tree-like phylogeny using some form of hierarchical agglomerative clustering algorithm (eg. Bernardi et al. 2016).

More positively, however, some papers have appeared that have instead pursued the idea of using a network model rather than a tree:
  • Liu et al. (2016) provided median-joining networks, which are unrooted splits graphs, to display relationships within each of three different virus groups;
  • Jang et al. (2013) infered a directed acyclic graph using a minimum spanning tree algorithm, with a post-processing step to allow nodes to have multiple parents;
  • Anderson et al. (2014) presented a novel algorithm based on a graphical lasso, which builds the phylogeny as an undirected graph, to which directionality is then added using a post-hoc heuristic;
  • Oyen et al. (2016) "present a novel Bayesian network discovery algorithm for learning a DAG [directed acyclic graph] via statistical inference of conditional dependencies from observed data with an informative prior on the partial ordering of variables. Our approach leverages the information on edge direction that a human can provide and the edge presence inference which data can provide."
It is important to note that only the works producing a directed graphs can represent a phylogeny — the other works produce unrooted graphs that may or may not reflect phylogenetic history. The bayesian work of Oyen et al. (2016) is particularly interesting:
Directionality is inferred by the learning process, but in many cases it is difficult to infer, therefore prior information is included about the edge directions, either from human experts or a simple heuristic. This paper introduces a novel approach to combining human knowledge about the ordering of variables into a statistical learning algorithm for Bayesian structure discovery. The learning algorithm with our prior combines the complementary benefits of using statistical data to infer dependencies while leveraging human knowledge about the direction of dependencies.

References

Anderson B, Lane T, Hash C (2014) Malware phylogenetics based on the multiview graphical lasso. Lecture Notes in Computer Science 8819: 1-12.

Bernardi ML, Cimitile M, Mercaldo F (2016) Process mining meets malware evolution : a study of the behavior of malicious code. Proceedings of the 2016 Fourth International Symposium on Computing and Networking, pp 616-622. IEEE Computer Society Washington, DC.

Goldberg LA, Goldberg PW, Phillips CA, Sorkin GB (1996) Constructing computer virus phylogenies. Lecture Notes in Computer Science 1075: 253-270. [also Journal of Algorithms (1998) 26: 188-208]

Jang J, Woo M, Brumley D (2013) Towards automatic software lineage inference. Proceedings of the Twenty-Second USENIX Conference on Security, pp 81-96. USENIX Association, Berkeley, CA.

Khoo WM, Lió P (2011) Unity in diversity: phylogenetic-inspired techniques for reverse engineering and detection of malware families. Proceedings of the 2011 First Systems Security Workshop (SysSec'11), pp 3-10. IEEE Computer Society Washington, DC.

Liu J, Wang Y, Wang Y (2016) Inferring phylogenetic networks of malware families from API sequences. Proceedings of the 2016 International Conference on Cyber-Enabled Distributed Computing and Knowledge Discovery, pp 14-17. IEEE Computer Society Washington, DC.

Oyen D, Anderson B, Anderson-Cook C (2016) Bayesian networks with prior knowledge for malware phylogenetics. The Workshops of the Thirtieth AAAI Conference on Artificial Intelligence Artificial Intelligence for Cyber Security: Technical Report WS-16-03, pp 185-192. Association for the Advancement of Artificial Intelligence, Palo Alto, CA.

Tuesday, January 17, 2017

What is the null hypothesis for a phylogeny?


As noted in the previous blog post (Why do we need Bayesian phylogenetic information content?), phylogeneticists rarely consider whether their data actually contain much phylogenetic information. Nevertheless, the existence of information content in a dataset implies the existence of null hypothesis of "no information", relative to the objective of the data analysis.

In this regard, Alexander Suh (2016), in a paper on the phylogenetics of birds, makes two important general points:
  • Every phylogenetic tree hypothesis should be accompanied by a phylogenetic network for visualization of conflicts.
  • Hard polytomies exist in nature and should be treated as the null hypothesis in the absence of reproducible tree topologies.
It is difficult to argue with the first point, of course. However, the second point is also an interesting one, and deserves some consideration. Suh notes that: "In contrast to ‘soft polytomies’ that result from insufficient data, ‘hard polytomies’ reflect the biological limit of phylogenetic resolution because of near-simultaneous speciation". That is, the distinction is whether polytomies result from simultaneous branching events (hard) or from insufficient sequence information (soft).

The matter of a suitable null hypothesis in phylogenetics has been considered before, for example by Hoelzer and Meinick (1994) and Walsh et al. (1999), who come to essentially the same conclusion as Suh (2016). Clearly, a network cannot be the null hypothesis for a phylogeny, and nor can a resolved tree (even partially resolved); the only logical possibility is a polytomy.

However, it seems to me that the current null hypothesis is effectively a soft polytomy, although no hypothesis is ever explicitly stated by most workers. Nevertheless, any evidence to resolve polytomies seems to be accepted, with evidence taken in descending order of strength in order to resolve any conflicting evidence. This inevitably produces a tree that is at least partly resolved, which is the alternative hypothesis.

On the other hand, resolving a hard polytomy requires unambiguous evidence for each branch in the phylogeny. If there is substantial conflict then it can only be resolved as a reticulation, or it must remain a polytomy. The existence of a reticulation, of course, results in a network, not a tree, so that the alternative hypothesis is a network, which may in practice be very tree-like.

So, in phylogenetics we have: null hypothesis = hard polytomy, alternative = network, rather than null hypothesis = soft polytomy, alternative = partially resolved tree.

As a final point, Suh claims that: "Neoaves comprise, to my knowledge, the first empirical example for a hard polytomy in animals." This is incorrect. There is also a hard polytomy at the root of the Placental Mammals, as discussed in this blog post: Why are there conflicting placental roots?

References

Hoelzer G.A., Meinick D.J. (1994) Patterns of speciation and limits to phylogenetic resolution. Trends in Ecology & Evolution 9: 104-107.

Suh A. (2016) The phylogenomic forest of bird trees contains a hard polytomy at the root of Neoaves. Zoologica Scripta 45: 50-62.

Walsh H.E., Kidd M.G., Moum T., Friesen, V.L. (1999) Polytomies and the power of phylogenetic inference. Evolution 53: 932-937.

Tuesday, January 3, 2017

Phylogenetics versus historical linguistics


Google Trends looks at recent trends in web searches, and it has been used to study patterns in web activity for many concepts. This is similar to The Ngram Viewer in Google Books (see the post Ngrams and phylogenetics). Google Trends aggregates the number of web searches that have been performed for any given search term (or terms), and it can display the results as a time graph, for any given geographical region. The Trends searches are somewhat restrictive, but they may show us something about the period 2004-2016 (inclusive).

So, I thought that it might be interesting to look at a few expressions of relevance to readers of this blog. The Trends graphs show changes in the relative proportion of searches for the given term (vertically) through time (horizontally). The vertical axis is scaled so that 100 is simply the time with the most popularity as a fraction of the total number of searches (ie. the scale shows the proportion of searches, with the maximum always shown as 100, no matter how many searches there were).


As you can see, the term "phylogenetics" has maintained its popularity over "historical linguistics". However, it has decreased in popularity through time much more than has "historical linguistics". Nevertheless, both decreases are very small compared to that for the term "bioinformatics", as discussed in the blog post on Bioinformaticians look at bioinformatics.

It is not necessarily clear to me why many technical terms have decreased in Google searches through time, although there are several possibilities. First, it could be Google itself. The Trends numbers represent search volume for a keyword relative to the total search volume on Google. So, actual search numbers for the technical terms could be increasing while as a fraction of total search volume of the internet they are decreasing, if total Google search volume is increasing. 

Alternatively, Business Insider has noted that "search is facing a huge challenge ... consumers are increasingly shifting [from desktop] to mobile. On mobile, consumers say they just don't search as much as they used to because they have apps that cater to their specific needs. They might still perform searches within those apps, but they're not doing as many searches on traditional search engines". Furthermore, "people are discovering content through social media. The top eight social networks drove more than 30% of traffic to sites in 2014".

The extra raggedness in search popularity in the first couple of years of the graph probably reflects inadequacies in the Google Trends dataset in the early years (as discussed by Wikipedia). The same is true for the next graph, as well.


The "phylogenetic tree" searches have been more popular than "evolutionary tree", just as was true for the Google Books usage discussed in the post Ngrams and phylogenetics. However, the "phylogenetic tree" searches show a distinctly bimodal pattern every year. This presumably reflects teaching semesters — few people search for technical terms out of term time!

Unfortunately, it is not possible to look at the term "phylogenenetic network", because Google Trends tells me that there is "Not enough search volume to show results". How rude!

Tuesday, December 6, 2016

Why are splits graphs still called phylogenetic networks?


This is an issue that has long concerned me, and which I think causes a lot of confusion among biologists. A phylogenetic tree is usually a clear concept — to a biologist, it is a diagram that displays a hypothesis of evolutionary history. The expectation, then, is that a phylogenetic network does the same thing for reticulate evolutionary histories. However, this is not true of splits graphs; and so there is potential confusion.

Mathematically, of course, a phylogenetic tree is a directed acyclic line graph. It is usually constructed, in practice, by first producing an undirected graph based on some pattern-analysis procedure, and then nominating one of the nodes or edges as the root (say, by specifying an outgroup). So, the mathematics is not really connected to the biological interpretation. To a mathematician, the tree is a set of nodes connected by directed edges, and the nodes could represent anything at all, as could the edges. It is the biologist who artificially imposes the idea that the nodes represent real historical organisms connected by the flow of evolution — ancestors connected to descendants by evolutionary events.

A phylogenetic network should logically be a generalization of this idea of a phylogenetic tree, adding the possibility of evolutionary relationships due to gene flow, in addition to the ancestor-descendant relationships. This can be done, but it is only partly done by splits graphs.

That is, a splits graph generalizes the idea of an undirected line graph (an unrooted tree), but not a directed acyclic graph (a rooted tree). It follows the same logic of using a pattern-analysis procedure to produce an undirected graph, although the graph can have reticulations, and thus is a network rather than necessarily being a bifurcating tree. However, it is not straightforward to specify a root in a way that will turn this into an acyclic graph. So, in general it does not represent a phylogeny.

Indeed, splits graphs are simply one form of multivariate pattern analysis, along with clustering and ordination techniques, which are familiar as data-display methods in phenetics (see Morrison D.A. 2014. Phylogenetic networks — a new form of multivariate data summary for data mining and exploratory data analysis. Wiley Interdisciplinary Reviews: Data Mining and Knowledge Discovery 4: 296-312). In this sense, it makes no difference whatsoever what the data represent — they can be data used for phylogenetics, or they could be any other form of multivariate data. Indeed, this point is illustrated in many of the posts in this blog, which can be accessed in the Analyses page.

So, unlike unrooted trees, unrooted splits graphs are not a route to producing a phylogenetic diagram. Mind you, they are a very useful form of multivariate data analysis in their own right, and I value them highly as a form of exploratory data analysis. But that doesn't make them phylogenetic networks in the biological sense.

So, isn't it about time we stopped calling splits graphs "phylogenetic networks"? They aren't, to a biologist, so why call them that?

Wednesday, August 31, 2016

Network thinking in phylogeography?


This blog has, of course, long championed the importance of network models in phylogenetics. Slowly, very slowly, the rest of the world is catching up.

Apparently, the world of phylogeography has now woken up:
Scott V. Edwards, Sally Potter, C. Jonathan Schmitt, Jason G. Bragg and Craig Moritz (2016) Reticulation, divergence, and the phylogeography–phylogenetics continuum. Proceedings of the National Academy of Sciences of the USA 113: 8025-2032.
Phylogeography was conceived as some sort of connection between population biology and phylogenetics. It has always seemed odd that the tree model has been used in phylogeography at all, because there is no a priori reason to expect within-species phylogenetic patterns to be tree-like. Indeed, inter-breeding seems to suggest quite the opposite. Nevertheless, phylogeographic studies are full of trees.


But apparently no more. To quote the authors:
As phylogeography moves into the era of next-generation sequencing, the specter of reticulation at several levels — within loci and genomes in the form of recombination and across populations and species in the form of introgression — has raised its head with a prominence even greater than glimpsed during the nuclear gene PCR era ... We discuss a variety of forces generating reticulate patterns in phylogeography, including introgression, contact zones, and the potential selection-driven outliers on next-generation molecular markers. We emphasize the continued need for demographic models incorporating reticulation at the level of genomes and populations ...
That phylogeography sits centrally in this process-oriented space emphasizes the importance of understanding interactions between reticulation (gene flow / introgression and recombination), drift, and protracted isolation. This combination of processes sets phylogeography apart from traditional population genetics and phylogenetics.
Scanning entire genomes of closely related organisms has unleashed a level of heterogeneity of signals that was largely of theoretical interest in the PCR era. This genomic heterogeneity is profoundly influencing our basic concepts of phylogeography and phylogenetics, and indeed our views of speciation processes. It is now routine to encounter a diversity of gene trees across the genome that is often as large as the number of loci surveyed.
The new genome-scale analyses are causing evolutionary biologists to reevaluate the very nature of species, which, in some cases, appear to maintain phenotypic distinctiveness despite extensive gene flow across most of the genome, and to recognize introgression as an important source of adaptive traits in a variety of study systems.
The role of horizontal gene flow in speciation and phylogeography, particularly for animal taxa, has long been championed by Michael L. Arnold (see the references). However, the authors ignore this literature, and claim that this is a recent insight, instead. They also mention only in passing the extensive genomics literature on human introgression, where it is called "admixture". Indeed, they mention only a data-analysis technique, rather than the biological insights that have arisen. It is still disappointing just how little information-connection there is between different fields of biology.

Finally, the authors manage to mention the work "network" only three times in the whole paper. Their key word is "reticulation", instead, in the sense that a phylogeny is a tree with reticulation, rather than any other form of network. So, they are still only one step away from tree-thinking, and at least one step from true network-thinking.

In the context of trees versus networks, the authors mention so-called "species tree" methods based on the multispecies coalescent, which try to account for incomplete lineage sorting in genome studies (see also Edwards et al. 2016). Unfortunately, these have recently been shown to be inconsistent in the presence of gene flow (Solís-Lemus et al. 2016), thus emphasizing the need for proper network methods.

References

Arnold ML (1997) Natural Hybridization and Evolution. Oxford University Press.

Arnold ML (2006) Evolution Through Genetic Exchange. Oxford University Press.

Arnold ML (2009) Reticulate Evolution and Humans – Origins and Ecology. Oxford University Press.

Arnold ML (2016) Divergence With Genetic Exchange. Oxford University Press.

Edwards SV, Xi Z, Janke A, Faircloth BC, McCormack JE, Glenn TC, Zhong B, Wu S, Lemmon EM, Lemmon AR, Leaché AD, Liu L, Davis CC (2016) Implementing and testing the multispecies coalescent model: a valuable paradigm for phylogenomics. Molecular Phylogenetics & Evolution 94: 447-462.

Solís-Lemus C, Yang M, Ané C (2016) Inconsistency of species tree methods under gene flow. Systematic Biology 65: 843–851.

Tuesday, April 26, 2016

Phylogeny of a dataset


Phylogenetic methods have been applied to all sorts of research fields, including biology, linguistics, stemmatology and archaeology. There are many posts in this blog discussing examples of these applications, both good and bad.

However, some time ago a paper appeared that tried to apply these methods to data, instead:
Andrea K. Thomer, Nicholas M. Weber (2014) The phylogeny of a dataset. In: Andrew Grove (ed.) Proceedings of the 77th ASIS&T Annual Meeting: Connecting Collections, Cultures, and Communities, Volume 51. ASIS&T, Silver Spring, Maryland 20910, USA.
The authors do a creditable job of describing phylogenetics for the uninitiated, but I am not convinced that their empirical application to "digital objects" works particularly well.

They describe their application as follows:
The digital objects under examination are different versions of the International Comprehensive Ocean and Atmosphere dataset (ICOADS).
ICOADS data consist of marine surface measurements and observations (e.g. sea-surface temperature, sea-level pressure, wave swell, wind direction, etc.) that have been digitized from historical ship logs, or taken from floating buoys. As a result of the broad time periods that the dataset covers (approximately 450 years, 1662–2014) the quality and reliability of the data varies considerably.
Much like a piece of software, ICOADS is an evolving dataset with intermittent releases. Version 1.0 – called simply COADS – was publically [sic] released in 1987, and contained almost 100 million historical observations starting in 1854 and continuing to 1979.
Thus, understanding the ways in which ICOADS evolved into new versions, and gave rise to "offspring" datasets over a thirty-year period is the focus of the case study presented below.
The significant properties being used as phylogenetic characters included: Entry Title, Entry ID, Summary, Geographic Coverage, Start Date, End Date, Geographic Resolution, Temporal Resolution, Scientific Keywords (often dataset parameters), Geographic Keywords, Sources (platform of data collection), and Instruments. Once collected, each field was converted into binary codes for "presence" or "absence" of individual keywords.
The problem here is that tere is no implication that any of these characters are phylogenetically informative (ie. inherited), and thus that shared features might represent synapomorphies. In applications to linguistics, stemmatology and archaeology, on the other hand, it is at least likely that shared similarities might represent synapomorphies.

Given these data, the analyses cluster the datasets based on similarity — indeed, the authors explicitly refer to their tree-based analyses as "clustering algorithms". However, this form of analysis does not necessarily reveal history, in the sense that none of the analyses are explicitly historical. Historical patterns will be included in the outcome, but they will not necessarily be separable from patterns resulting from any other source. The resulting groups of datasets may or may not have historical meaning. The authors do, however, have a series of hypotheses (the groups) that can now be subject to scrutiny for possible historical interpretations.

For our purposes it is also worth noting that the authors do recognize one limitation of their analytic approach when applied to datasets:
A purely tree-based phylogenetic approach is also incapable of showing the exchange of traits between different lineages of digital objects, or cases in which several organisms merge into one; thus a reticulating network may be needed in lieu of a bifurcating tree.

Monday, April 4, 2016

GeneaQuilts


The drawing of large genealogies is not easy, and phylogeneticists (among others) have tried a number of solutions, including circular diagrams as we as interactively zoomable displays. One interesting solution that does not appear to have yet been used in phylogenetics is the concept of GeneaQuilts.

These were introduced by the Visual Analytics Project:
A. Bezerianos, P. Dragicevic, J.-D. Fekete, J. Bae, B. Watson (2010) GeneaQuilts: a system for exploring large genealogies. In: IEEE InfoVis '10: IEEE Transactions on Visualization and Computer Graphics, Oct 2010, Salt-Lake City, USA.
The web page has a video introducing the concept, which does a better job than I can do here. The basic idea is to abandon the tree / network representation, and to use a diagonally-filled matrix instead, where the rows are individuals and the columns show parent-offspring relationships.

Here is an example genealogy, based on the reported relationships among the Greek Gods.


If the relationships are tree-like then the diagram will be concentrated on the diagonal of the matrix. However, network relationships (inbreeding) will cause off-diagonal elements, two of which are shown in the example: one involves Hades and his niece Persephone.

Several, much larger examples are displayed on the GeneaQuilts website. There is a program that can be downloaded, which takes as its input standard family-history files.

There seems to be no intrinsic reason why this display form could not also be used in phylogenetics.

Tuesday, March 22, 2016

The phylogeny of elves and other fantastic figures


I have previously pointed out that phylogeny reconstructions exits for legendary figures, cartoon animals, Donald Duck, Pokémon, and dragons (see Faux phylogenies). Another popular topic has been the figures of fantastical literature such as elves, dwarves, goblins, gnomes and trolls. Here I present a few of the better-known ones from around the web.

Elves

The first one comes from Dominic Evangelista's blog post at The Eco Tome called Phylogeny of elves finds that santa’s workers are actually dwarves. The original data matrix is provided, but the comments on that post point out a few errors in the character coding.


Dungeons & Dragons Elves

This next one comes from Limey Boy's blog, and specifically pertains to the D&D Elven Phylogenetic Genealogical Tree.


There is a related post on the D&D Human Phylogenetic Genealogical Tree, with a much more extensive genealogy.

Fairyland

Next we have a small tree from Terry Newman covering The Natural History of Fairyland.


Fantasy Races

Then we have a somewhat bigger tree from Reddit covering the Evolutionary Phylogeny of Fantasy Races. This seems to have multiple roots, unlike the other genealogies above.


Lord of the Rings

Finally, we have the genealogy to end all fantasy genealogies. The Lord of the Rings Project has a complete interactive genealogy of all of the works of J.R.R. Tolkien. It is way too large to show here, even in miniature, and is actually a series of genealogies that are not connected. However, it is worth noting that, unlike the above genealogies, while most of the genealogies are tree-like many are actually networks because both sexes are included.