
One of the most interesting side effects of using Big Data in phylogenetics has been the realization that individual gene trees may be wrong as an estimation of the genome phylogeny. In the past, the easy "solution" was just to add more and more gene data until any topological ambiguity disappears, leaving us with a fully resolved, all-inclusive, tree.
However, even with increasing amounts of data, some relationships remain ambiguous. Adding data sometimes reveals primary conflict in the data, eg. because of a reticulate phylogenetic history. With modern-day software, we can quickly infer trees and compare them. Less straightforward is the interpretation of the observed conflict and what to do with it.
In our The Emperor has no clothes blog mini-series [Pt 1 – the mighty matK, Pt 2 – a thicket of trees, Pt 3 – conflict or not], I discussed gene incongruence in the complete angiosperm plastome data, which some people have interpreted as evidence for inter-plastome reticulation (recombination), as well as discussing the role that a single gene may play when inferring a trees based on a concatenated, multi-gene data set.
A new analysis
In this new post, I will show what a supernetwork can tell us about gene conflict using the data from a recent (open access and open data) paper investigating deep relationships in (land) plants.
Sousa F, Civáň P, Brazão J, Foster PG, Cox CJ. 2020. The mitochondrial phylogeny of land plants shows support for Setaphyta under composition-heterogeneous substitution models. PeerJ 8:e8995.This is what the authors state:
Majority-rule consensus trees resulting from the best-fitting Bayesian MCMC analyses of individual genes had low resolution in general, but
liverworts were supported (>95% posterior probability (PP)) as the earliest-branching lineage in two genes (nad 3 and nad 5), whereas the mosses were supported as the earliest-branching lineage in one gene (ccm C). All other resolutions of the bryophyte lineages relative to the
tracheophyte clade were not statistically supported, and the Setaphyta clade was not resolved in any gene tree.
The authors objective was to filter the data, leaving those genes and information that can provide a better tree — ie. a less
ambiguous one, resolving the deep relationships in land plants. Filtering the additive weak signals in each gene, and countering the problem of codon bias, leads to the fully resolved,
unambiguously supported concatenated tree shown below. |
| Sousa et al.'s fig. 2, a fully resolved (all branches have PP = 1) Bayesian tree inferred from the concatenated 36 gene amino acid data. The novelty is the unambiguous support and recognition of a Septaphyta clade composed of liverworts (turquois) and mosses (brown). |
The zenodo link provides full access to the data used. It includes:
- the single-gene nucleotide and translated amino acid matrices,
- the single-gene Bayesian majority rule consensus trees (MRC)
- a concatenated 36-gene nucleotide and amino acid matrix, plus one cleaned for substitution bias ("codon degenerate"), and the resulting ML trees.
Why use a Supernetwork
Typically, we might just display the Consensus network of the single-gene trees (eg. summarizing branch-lengths or using averaged branch-lengths), and then compare it to the "preferred" concatenated tree (above). But, the data at hand includes missing gene partitions: some gene trees have fewer leaves. Consensus networks need tree samples that all have the same set of tips, while Supernetworks, on the other hand, can handle trees with different tip sets.
Here is the Supernetwork for our data, using the z-closure algorithm and tree-size averages for edge lengths (Huson et al. 2004, IEEE/ACM Trans. Comput. Biol. Bioinform. 1: 151–158).
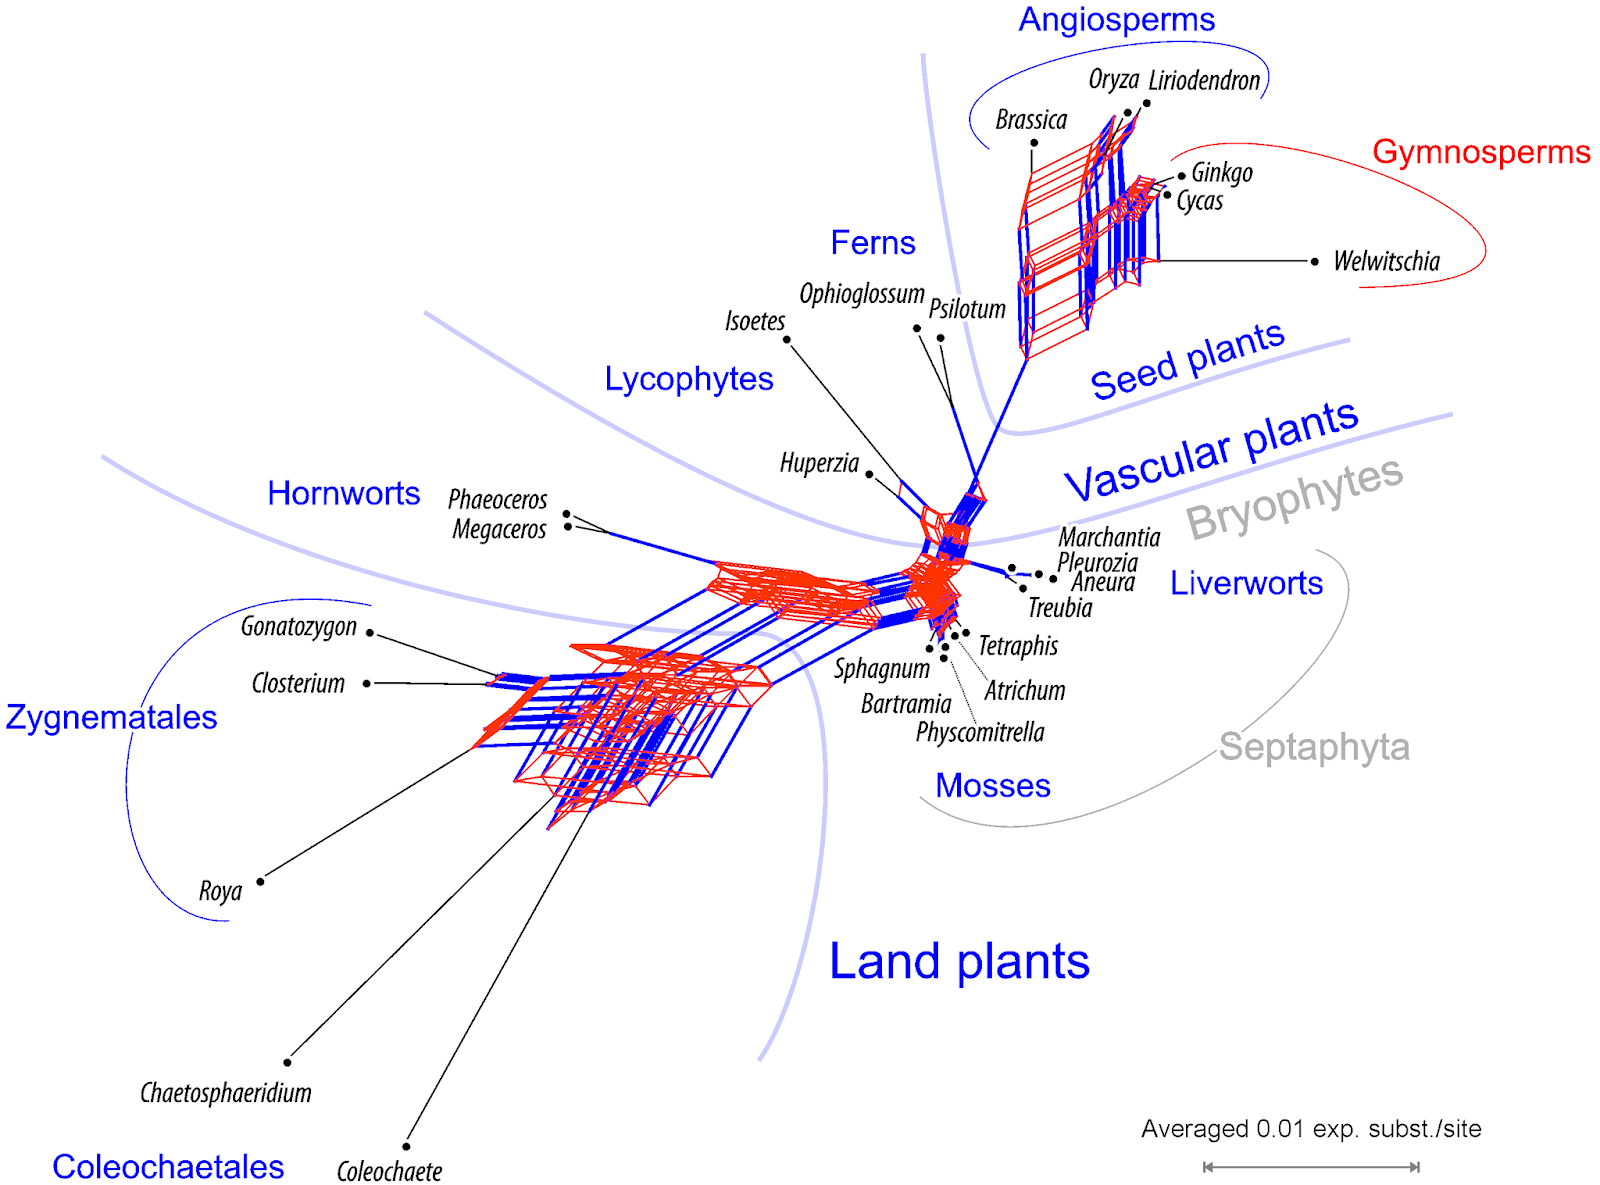 |
| Supernetwork of the 36 mitochondrial gene trees. Edge bundles corresponding to branches in Sousa et al.'s fully resolved tree in blue, conflicting edge bundles in red. Gray, systematic groups not represented by according branches (taxon bipartitions) in any gene tree. |
This Supernetwork is not based on the MRC provided, but gene-based ML trees. MRC trees are not strictly phylogenetic trees (Losing information in phylogenetic consensus; Why should we present a Bayesian phylogenetic analyses using networks): they can include, as in this case, polytomies originating from collapsing branches below a certain PP threshold. To distill and visualize the primary (raw) signal, I also did not partition the codons; treating the often saturated (in the case of mt DNA) third codon position as distinct data partition, would be obligatory in case we wanted to have the best-possible phylogenies.
Although the network is quite boxy (not tree-like), it does contain nearly all of the edges (branches; in blue) that make up Sousa et al.'s fully resolved, concatenated amino acid tree, with the exception of the Septaphyta edge (as noted by Sousa et al.) Although we used the suboptimal nucleotide matrices and none of our gene trees was fully congruent with the concatenated amino acid tree, they all included aspects of it (despite not filtering or correcting for codon bias).
When talking about gene incongruence, use a Supernetwork
Supernetworks (see also Whitfield et al. 2008, Syst. Biol. 57: 939–947) are much under-used graphs, ideal to visualize statements such as the one by Sousa et al. quoted above. They not only show the full extent of the gene tree incongruence but also to what degree it relates to short or long branches in the gene trees — this is something that, eg., cloudograms, fail to do. While a cloudogram is a summary of cladograms (sister relationships), a Supernetwork is a summary of phylograms, phylogenetic trees informing us about the amount of change. Keeping an eye on branch lengths helps a lot when interpreting branch support and discussing tree topologies, especially trees based on concatenated gene data (filtered or not).
No comments:
Post a Comment