
The comments of David Marjanović to one my last posts (Please stop using cladograms!), kept me musing about an old question of mine: Why should we be concerned about whether characters in a matrix are independent or not?
When I started to get into phylogenetics (I taught myself by reading and just doing it and never had a course in phylogenetics at university), I learned that the most important thing for a phylogenetic matrix is:
All characters are independent of each other.
In other words: the mutation (change) in one character doesn't affect the mutation (change) in any other character.I could never wrap my head around this. After all, the characters are all part of the same organism and must therefore function together, so how can they possibly be biologically independent? Even the fact that everything is part of the same universe means that everything is functionally dependent to one extent or another — when a butterfly sneezes the polar bears tremble, as they poetically say.
However, what is meant is that characters must be independent enough for practical mathematical purposes. This is a fundamental assumption of most mathematical analyses, in order to make them tractable. Trying to account for the dependencies is far too difficult, mathematically.
However, it is still worthwhile thinking about whether these "practical purposes" are likely to be realistic for phylogenetics. Consider this:
- Traditional phylogenetics mostly uses morphological traits, some of which must have been evolutionary beneficial and evolved as consequence of the same reason (adaptive process).
- Working at the tips of the tree of life, our data were from the nuclear-encoded 35S rDNA, the cistron encoding for 18S rRNA (small subunit), 5.8 S rRNA, and 25 rRNA (large subunit, erroneously called 26S in some of the phylogenetic literature), which is known for compensatory mutations (eg. strands of the 5.8S rRNA have to fit to the 5' end of the 25S rRNA; here's a link for those interested in RNA structure).

Without sequencing their entire genomes and establishing the function of each gene (and kicking out one or another gene during development), we cannot assess how independent (genetically) the traits are that make a dolphin a near-perfect swimmer, and a bat the only actively flying mammal. But obviously, a lot of their traits are adapted to this single function of movement. The practical consequence is that instead of a plethora of distinguishing characters, we only can score two fully independent ones: "can swim" versus "can fly".
(And then eliminate these two, because another rule in phylogenetics is that we should only include characters that are not under positive selection. The commonly implemented models all assume that evolution is neutral. This is why Charles Darwin has two parts to The Origin, one discussing historical dependence of characters and one discussing natural selection.)
As for point 2, everyone who worked with ITS, the internal transcribed spacers of the 35S rDNA, can easily see that some mutational patterns always come in pairs or some other series. Although rarely done, we can correct for linked mutations during inference by using the assumed secondary structures as a functional corrective. This is rarely done, because even without this correction you still get trees (or networks) that make sense.
 |
| Linked mutations and evolutionary trends within the LP3 of the 5' ITS2 in species of Acer section Acer (see my Ph.D. thesis, open access; figure from Grimm et al., Plant Syst. Evol., 2007). This (non-coding) length-polymorphic region (found in all angiosperms in various modifications) comprises an upstream CT- and partly linked (complementary) downstream GA-motif. |
A very simple example
Let's take a group of very simple, made-up organisms differing in two trait complexes (note that it may be a collection of genes that trigger the difference): form and colour.

In total, "evolution" came up with 15 different combinations ("species"), five of which are extinct, two of which are primitive in the sense that they still occur today, but have also been found as fossils.
We all know that morphologies have a high level of homoplasy. Homoplastic traits mean that groups will not accurately reflect the true tree. Having as many forms (9) as colors (9), we have no clue as to which trait is more conservative, and hence could better reflect the true tree.
 |
| The 15 species form nine potentially monophyletic genera. |
 |
| The alternative nine potentially monophyletic genera. |
The promise of phylogenetics is that we can infer the true tree based on the scored characters. We could follow the strict independence rule, and score them as two multi-state characters, leading us to the following "tree" — this has been parsimony-optimized and unweighted, as in most studies using morphological data, with the sample of MPTs summarized using a strict consensus cladogram.
 |
| The strict consensus tree of 355602 equally parsimonious trees with 17 steps, a CI of 0.94 and RI of 0.88: a pitchfork (an extreme case, but pitchfork-like subtrees are very common in palaeontological phylogenetic literature). |
Alternatively, we could score the features as a series of binary characters such as:
- Is the center depressed?
- Is it horizontally or vertically elongated?
- Is it round or pointed?
- Do we have few (<= 6) or many tips (>= 8; "?" for all round species)?
- Is it reddish? Or greenish? Or bluish? (Example: purple doughnut would be 1 - 0 - 0, the turquoise five-star 0 - 1 - 1)
- Has it a dark or light shade (relatively speaking: green taken as darker than turquoise)?
 |
| Adams consensus tree of 80 MPTs with 19 steps, CI = 0.57, RI = 0.79, naming follows the principles of cladistic classification (only subtrees in a rooted tree may be named; not to be confused with phylogenetic classification fide Hennig) |
However, it doesn't look like a very bad evolutionary hypothesis. In fact, the inferred clades only miss one monophyletic group (I can tell, because I invented this group to illustrate that 'cladistics' is a subset of 'phylogenetics'): Fivestar reflects the morph of the common ancestor of all stars, resolved as part of a monophyletic grade "basal" to the (reciprocally monophyletic) polygons:
 |
| Evolution as it happened. Note, each dichotomy is accompanied by one or two exclusive subsequent mutations (synapomorphies at the time). Unknown ancestors (not found in the fossil records) are dimmed. Green: valid names following Hennig's phylogenetic classification; orange: only valid for the most recent time frame (Purpleoval is indistinguishable from the ancestor of all non-olive Roundish, Fivestar from the ancestor of all stars, and the ancestor of all polygons was a blue pentagon). |
Of course, I would always show all of the topological alternatives in the optimized tree sample. Here is the strict consensus network of all of the MPTs:
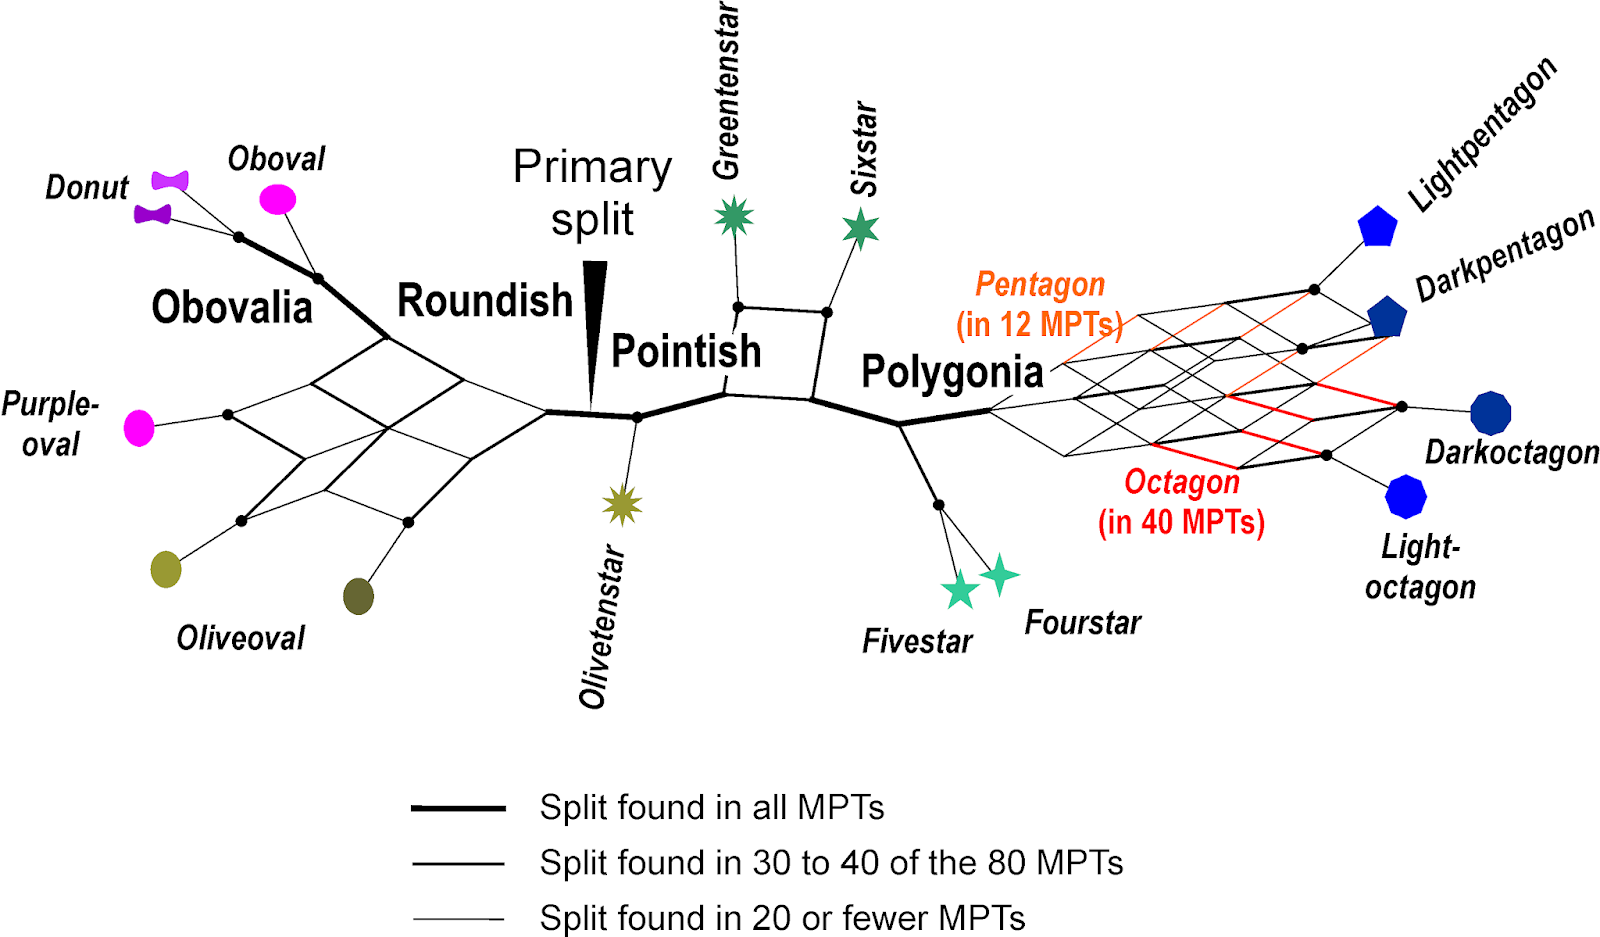 |
| Strict consensus network of all 80 MPTs, the network analogue to the commonly seen strict consensus cladograms. |
In contrast to the consensus trees, we see the equally optimal alternatives, and can even make a call as to which trait to give a higher weight (evolution-wise). For instance, although only 12 MPTs have a Pentagon clade, 40 have an Octagon clade, which would fit with the hypothesis of reciprocal monophyly. The shading-based alternative seen in other MPTs (light vs. dark polygons) can be argued to be less likely, noting how scattered this feature is across the entire graph (this is what TNT's iterative weighting does, except that it starts from one of the alternative trees)

And here's the distance network, probably (like with real-world data) the least-biased depiction of the differentiation pattern:
 |
| All labelled taxa are monophyletic (as defined by the true tree). Note how some neighborhoods reflect monophyly while others would result in paraphyletic groups. |
Take-home message
Now, you could rightfully point out that this is totally hypothetical and, having generated the group, I made sure that the analysis works out — actually, I didn't, and I was quite surprised at how well the binary matrix, which just scores everything that differs between the species, resolves aspects of the true tree. However, just compare the above graphs with trees published in (paleo)phylogenetic studies, and the real-world data we dealt with here on the Genealogical World of Phylogenetic Networks.
You might also point out that this is just like using stepmatrices — forcing a topology by suitably coding complex characters. Likewise, this thought must be discouraged (but see Joe Felsenstein 2004 book, Inferring Phylogenies). I would respond that scoring complex traits filtered by evolution as a single multi-state character severely underestimates the information content. An example from my own research: in the King Ferns (Osmundaceae), the subsequent modification of the sclerenchyma ring along the leaf traces is fully compatible with the molecular tree, so why should I be forced to reduce the surely interdependent (and traceable in the fossil record) aspects of this evolutionary filtered trait complex to a single, multi-state (and unweighted) character?
 |
| Coding of a single complex trait (Bomfleur et al., PeerJ, 2017, fig. 7), the structure of the sclerenchym ring in Osmundaceae leaf traces, as five binary characters that reflect the ontogenetic sequence seen in Osmundaceae rhizomes (arrows), a case where ontogeny mirrors phylogeny (Bomfleur et al., BMC Evol. Biol., 2015; cf. Additional file 1, fig. S1-1). |
If we have character complexes that we can score, then we should not bother ourselves with drawing a (often very subjective) line between biologically dependent and independent characters. We should just score as much as we can see, and then explore the signal in the resulting matrix (see our many blog posts on the latter topic).
Exploratory data analysis benefits from few-state characters. This is because characters with many states (nine in the above example, which is something also found in the actual literature) that do not inform any taxon bipartitions, lead only to quite useless pitchfork-trees.
Scoring what we see as detailed as possible may, of course, get some things wrong. We may face one or another paraphyletic (or even polyphyletic) clade and monophyletic grade — inferring trees/networks and establishing branch-support with more than a single optimality criterion is advisable as is character mapping. At least it gets us a data-based hypothesis to discuss and to investigate further; or several hypotheses, when using consensus networks or distance-based splits graphs instead of consensus trees.
No comments:
Post a Comment