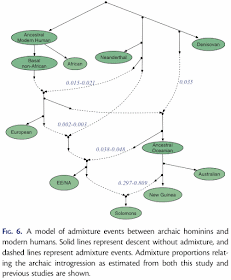
A look at the modern literature clearly shows that many, if not most, researchers do not use network methods when exploring reticulate evolutionary histories. As examples of the range of possible approaches, I will briefly discuss two papers from a recent journal issue.
Archaic introgression
Pengfei Qin and Mark Stoneking (2015) Denisovan ancestry in East Eurasian and Native American populations. Molecular Biology and Evolution 32: 2665-2674.The data used for this study of archaic introgression in hominids were genome-wide SNPs from 2,493 modern humans, plus a chimpanzee and two fossils, one from the only known Denisovan individual and one from a Neandertal. The data were reduced to f4 summary statistics, which assess the correlation between the allele frequency differences of two pairs of populations. (If populations A and B are consistent with forming a clade with respect to populations C and D, then the f4 statistic is expected to be 0.) The proportions of introgressions between populations were then calculated as the ratios between selected f4 statistics. Finally, the results of the series of calculations were presented as an admixture (or introgression) network.
There are design problems with this experiment, but at least the authors do use an explicit method to produce the introgression pattern for their phylogenetic network. They do, however, draw the network manually.
The obvious experimental problem is lack of replication, which is a basic requirement of traditional science. In this case, the work is ostensibly about archaic introgression, but there is no replication of the Denisovan, Neandertal or chimpanzee samples, which are the key ones for quantifying archaic patterns. Mind you, there are only a couple of bones of the Denisovan, so the lack of replication is hardly surprising, however regrettable it may be.
There are also technical problems, such as the artifactual arch pattern in the PCA plot (see Distortions and artifacts in Principal Components Analysis analysis of genome data).
Finally, note that the "introgression" arrows in the network do not point from the ostensible source but always from a sister taxon of that source. This is basically the argument that we cannot know ancestors, and so we must represent them as sister taxa to their putative descendants in an evolutionary diagram.
Yeast recombination
Baojun Wu, Adnan Buljic and Weilong Hao (2015) Extensive horizontal transfer and homologous recombination generate highly chimeric mitochondrial genomes in yeast. Molecular Biology and Evolution 32: 2559-2570.The authors studied aligned sequences of 40 mitochondrial genomes from yeasts, and report "extensive, homologous-recombination-mediated, mitochondrial-to-mitochondrial HGT, leading to genomes that are highly chimeric." Recombination was evaluated using various methods from the RDP4 program. Horizontal gene transfer (HGT) was evaluated by comparing different mitochondrial genome regions (introns as well as exons). No phylogenetic network was presented to summarize the phylogenetic relationships, just a long series of incongruent gene (or locus) trees.
The lack of a network summary of HGT studies is quite common. This is in spite of programs available to evaluate HGT and display the results. The focus in such studies seems to be on mechanisms, instead, rather than on the phylogenetic history.
The general experimental issue with the study of HGT is that evidence for it is solely inference from incongruence: (i) incongruent gene trees must be the result of either incomplete lineage sorting (ILS), gene duplication-loss (DL) or gene flow, and (ii) if it is the latter and the taxa are not closely related, then it is called HGT. This is not particularly evidence, especially when ILS and DL are not explicitly evaluated. These days, there are several methods available for doing this.


No comments:
Post a Comment