Pages

Monday, July 27, 2020

Automated detection of rhymes in texts (From rhymes to networks 4)


Having discussed how to annotate rhymes in last month's blog post, we can now discuss the automated detection of rhymes. I am fascinated by this topic, although I have not managed to find a proper approach yet. What fascinates me more, however, is how easily the problem is misunderstood. I have witnessed this a couple of times in discussions with colleagues. When mentioning my wish to create a magic algorithm that does the rhyme annotation for me, so that I no longer need to do it manually, nobody seems to agree with me that the problem is not trivial.

On the contrary, the problem seems to be so easy that it should have been solved already a couple of years ago. One typical answer is that I should just turn to artificial intelligence and neural networks, whatever this means in concrete, and that they would certainly outperform any algorithm that was proposed in the past. Another typical answer, which is slightly more subtle, assumes that some kind of phonetic comparison should easily reveal what we are dealing with.

Unfortunately, none of these approaches work. So, instead of presenting a magic algorithm that works, I will use this post to try and explain why I think that the problem of rhyme detection is far less trivial than people seem to think.

Defining the problem of automated rhyme detection

Before we can discuss potential solutions to rhyme detection, we need to define the problem. If we think of a rhyme annotation model that allows us to annotate rhymes at the level of specific word parts (not restricted to entire words), the most general rhyme detection problem can be presented as follows:
Given a rhyme corpus that is divided into poems, with poems divided into stanzas, and stanzas being divided into lines, find all of the word parts that clearly rhyme with each other within each stanza within each poem within the corpus.
With respect to machine learning strategies, we can further distinguish supervised versus unsupervised learning. While supervised learning for the rhyme detection problem would build on a large annotated rhyme corpus, in order to infer the best strategies to identify words that rhyme and words that do not rhyme, unsupervised approaches would not require any training data at all.

With respect to the application target, we should further specify whether we want our approach to work for a multilingual sample or just a single language. If we want the method to work on a truly multilingual (that is: cross-linguistic) basis, we would probably need to require a unified transcription for speech sounds as input. It is already obvious that, although the annotation schema I presented last month is quire general, it would not work for those languages with writing systems that are not spelled from left to write, for example, not to speak of writing systems that are not alphabetic.

Why rhyme detection is difficult

It is obvious that the most general problem for rhyme detection would be the cross-linguistic unsupervised detection of rhymes within a corpus of poetry. Developing systems for monolingual rhyme detection seems to be a bit trivial, given that one could just assemble a big list of words that rhyme in a given language, and then find where they occur in a given corpus. However, given that the goal of poetry is also to avoid "boring" rhymes, and come up with creative surprises, it may turn out to be less trivial than it seems at first sight.

As an example, consider the following refrain from a recent hip-hop song by German comedian Carolin Kebekus, in which the text rhymes Gemeinden (community) with vereinen (unite), as well as Mädchen (girl) with Päpstin (female pope) (the video has English subtitles for those who are interested in the text but do not speak German).

Figure 1: Rhyme example from a recent German hip-hop song.

While one could argue whether those words qualify as proper rhymes and were intended as such, I am quite convinced that the words were chosen for their near-rhyme similarity, and I am also convinced that most native speakers of German listening to the song will understand the intended rhyme here. Both rhymes are not perfect, but they are close enough, and they are beyond doubt creative and unexpected — it is extremely unlikely that one could find them in any German rhyme book. This example shows that humans' creative treatment of language keeps constantly searching for similarities that have not been used before by others. This leads to a situation where we cannot simply use a static look-up table of licensed rhyme words, to solve the problem of rhyme detection for a particular language.

What we instead need is some way to estimate the phonetic similarity of words parts, in order to check whether they could rhyme or not. However, since languages may have different rhyme rules, these similarities would have to be adjusted for each language. While phonetic similarity can be measured fairly well with the help of alignment algorithms applied to phonetic transcriptions, what counts as being similar may differ from language to language, and rhyme usually reflects local similarity of words.

Since rhyme is closely accompanied by rhythm and word or phrase stress, we would also need this information to be supplied from the original transcriptions. All in all, working on a general method for rhyme detection seems like a hell of an enterprise, specifically whilever we lack any datasets that we could use for testing and training.

Less interesting sub-problems and proposed solutions

While, to the best of my knowledge, nobody has every tried to propose a solution for the general problem of rhyme detection as I outlined it above, there are some studies in which a sub-problem of rhyme detection has been tackled. This sub-problem can be presented as follows:
Given a rhyme corpus of poems that are divided into stanzas, which are themselves divided into lines, try to find the rhyme schemas underlying each stanza.
This problem, which has been often called rhyme scheme discovery, has been addressed using at least three approaches that I have been able to find. Reddy and Knight (2011) employ basic assumptions about the repetition of rhyme pairs in order to create an unsupervised method based on expectation maximization. Addanki and Wu (2013) test the usefulness of Hidden Markov Models for unsupervised rhyme scheme detection. Haider and Kuhn (2018) use Siamese Recurrent Networks for a supervised approach to the same problem. Additionally, Plechač (2018) proposes a modification of the algorithm by Reddy and Knight, and tests it on three languages (English, Czech, and French).

One could go into the details, and discuss the advantages and disadvantages of these approaches. However, in my opinion it is much more important to emphasize the fundamental difference between the task of rhyme scheme detection and the problem of general rhyme detection, as I have outlined it above. Rhyme scheme detection does not seek to explain rhyme in terms of partial word similarity, but rather assumes that a general overarching structure (in terms of rhyme schemas) underlies all kinds of rhymed poetry.

There are immediate consequences to assuming that rhymed poetry needs to be organized by rhyme schemes. First, the underlying model does not accept rhymes that occur in any other place than the end of a given line, which is problematic, specifically when dealing with more recent genres like hip-hop. Second, if one assumes that rhyme scheme structure dominates rhymed poetry, the model does not accept any immediate, more spontaneous forms of rhyming, which, however, frequently occur in human language (compare the famous examples in political speech, discussed by Jakobson 1958).

Concentrating on rhyme schemes, instead of rhyme word detection, has immediate consequences for the algorithms. First, the methods need to be applied to "normal" poetry, given that any form of poetry that evades the strict dominance of rhyme schemes cannot be characterized properly by the underlying rhyme model. Second, all that the methods need as input are the words occurring at the end of a line, since these are the only ones that can rhyme (and the test datasets are all constructed in this way alone). Third, the methods are all trained in such a way that they need to identify rhymes in a text, so that they cannot be used to test whether a given text collection rhymes or not.

Outlook

In this post, I have tried to present what I consider to be the "ultimate" problem of rhyme detection, a problem that I consider to be the "general" rhyme detection problem in computational approaches to literature. In contrast, I think that the problem of detecting only rhyme schemes is much less interesting than the general rhyme detection problem. The focus on rhyme schemes, instead of focusing on the actual words that rhyme, reflects a certain lack of knowledge regarding the huge variation by which people rhyme words across different languages, cultures, styles, and epochs.

If all poetry followed the same rhyme schemes, then we would not need any rhyme detection methods at all. Think of Shakespeare's 154 sonnets, all coded in the same rhyme schema: no algorithm would be needed to detect the rhyme schema, as we already know it beforehand — for a perfect supervised method, it would be enough to pass the algorithm the line numbers and the resulting schema.

The picture changes, however, when working with different styles, especially those representing an emerging rather than an established tradition of poetry. Rhyme schemes in the most ancient Chinese inscriptions, for example, are far less fixed (Behr 2008). In modern hip-hop lyrics, which also represent a tradition that has only recently emerged, it does not make real sense to talk about rhyme schemes either, as can be easily seen from the following excerpt of Akhenaton's Mes soleils et mes lunes, which I have tried to annotate to the best of my knowledge.

Figure 2: First stanza from Akhenaton's Mes soleils et mes lunes

Surprisingly, both Haider and Kuhn (2018), as well as Addanki and Wu (2013) explicitly test their methods on hip-hop corpora. They interpret them as normal poems, extract the rhyme words, and classify them line by line. I would be curious what these methods would yield if they are fed non-rhyming text passages. For me, the ability of an algorithm to distinguish rhyming from non-rhyming texts is one of the crucial tests for its suitability. We do not need approaches that confirm what we already know.

Ultimately, we hope to find methods for rhyme detection that could actively help us to learn something about the difference between conscious rhyming versus word similarities by chance. But, given the huge differences in rhyming practice across languages and cultures, it is not clear if we will ever arrive at this point.

References

Addanki, Karteek and Wu, Dekai (2013) Unsupervised rhyme scheme identification in Hip Hop lyrics using Hidden Markov Models. In: Statistical Language and Speech Processing, pp. 39-50.

Behr, Wolfgang (2008) Reimende Bronzeinschriften und die Entstehung der Chinesischen Endreimdichtung. Bochum:Projekt Verlag.

Haider, Thomas and Kuhn, Jonas (2018) Supervised rhyme detection with Siamese recurrent networks. In: Proceedings of Workshop on Computational Linguistics for Cultural Heritage, Social Sciences, Humanities and Literature, pp. 81-86.

Jakobson, Roman (1958) Typological studies and their contribution to historical comparative linguistics. In: Proceedings of the Eighth International Congress of Linguistics, pp. 17-35.

Plecháč, Petr (2018) A collocation-driven method of discovering rhymes (in Czech, English, and French poetry). In: Masako Fidler and Václav Cvrček (eds.) Taming the Corpus: From Inflection and Lexis to Interpretation. Cham:Springer, pp. 79-95.

Monday, July 20, 2020

Media misunderstandings about the coronavirus in Sweden


The worldwide spread of the SARS-CoV-2 virus, and the consequent Covid-19 disease pandemic, is still a topic of conversation, although it does seem that many people are sick of hearing about it. They just want to "get back to normal", without understanding that this is going to take many months, if it happens at all. There is every possibility that there will be a "new normal" from now on, and in many places the virus will be endemic.

We started off knowing little about this virus and the disease that it causes, as I have written about before (There seems to be a lot of public misunderstanding about the coronavirus); and we have slowly accumulated more and more understanding of what we should be doing in response. In particular, the future of having to live with the virus is becoming clearer, until (or if) we reach herd immunity (A new understanding of herd immunity).

Among all of this, there has been some commentary about the official response within Sweden, with some media (and the World Health Organization) claiming that the Swedes have reacted in a different and controversial manner. This is far from the truth, as I happen know, because I now live in Sweden, although I grew up in Australia. As a resident biological scientist, I thought that I might write about the situation, in this post. There have been massive quarantine efforts here, although for cultural reasons they might look quite different to how such things are organized in the English-speaking parts of the world. [Note: Japan has also used a different strategy to most other places, but without any serious criticism, although it is now experiencing a serious "second wave".]


Many of the misleading media reports, have originated in the USA, which currently has the world's biggest Covid problem. The latter may soon change, because there is every reason to expect India to surpass the US infection count, as its rate is still rapidly increasing and India has a much larger population. I hope to be wrong on this matter, but it will be very hard to contain spread among the masses of poor people in that country. Maybe their saving grace will be the fact that the majority of their population is younger than 40 years old, so that the death rate will be contained.

Anyway, we have had US media reports about Sweden such as these:
The latter article contains this quote:
At one end of the spectrum, Sweden chose to forgo severe restrictions on public life and its economy and opt to let the virus spread through its population while shielding the most vulnerable groups.
Both pieces of information here are wrong. Sweden has not allowed the virus to spread, but has instead instituted quarantine measures; and it has failed miserably in its efforts to protect the prime vulnerable group: the elderly.

Virus spread in Sweden

Let's start by looking at the actual data. Here is a table of the current officially reported number of SARS cases as of July 18 (as collated on the Worldometer web site). Note that the information we are interested in is the case rate (percent of population affected), not the number of cases. The number of cases is determined mainly by the population size — of course the USA has more cases than Sweden, for example, because there are 330 million Americans and only 10 million Swedes.


As you can see, the case rate in the USA is 10,500 per million people, whereas in Sweden it is only three-quarters of this, at 7,500 cases. So, who is doing better at containing the spread of the virus? Mind you, within Europe, only Armenia and Luxembourg have higher reported rates, along with tiny places like San Marino, Andorra and the Vatican City (where even a few cases can create apparent large rates, due to the small sample size).


Moreover, the number of new cases per day in Sweden is now as low as at any time since mid March, as shown in this next graph (also from Worldometer). The apparent burst in cases after June 5 was due to the government finally implementing large-scale virus testing, which always increases the detection rate for this type of situation. The subsequent decrease in cases suggests that Sweden may well be moving towards herd immunity, which is required for long-term epidemic control. This week's report from Folkhälsomyndigheten (the Public Health Agency) shows a continue decrease in the proportion of positive tests, despite a continued high level of sampling.

The Swedish situation contrasts with the current situation in the USA, where the number of new cases is higher than at any previous time, being double what it was during the April-June period. This is, at least in part, due to a massive sampling effort now on, which I noted above will increase the case detections.


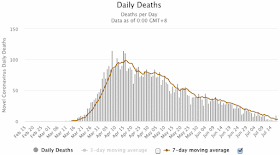
The same trend can be seen in the number of new daily deaths in Sweden — it is now as low as at any time since mid March. The number of US deaths, on the other hand, has surged this month (although it is still less than a half of what it was back in April). Sweden may be a cautionary tale, perhaps; but the criticism sounds more like sour grapes, to me, from the media of a country that has clearly handled this pandemic worse than anyone else.

It is important to mention a point of difference, as it has become increasingly obvious that different jurisdictions have compiled coronavirus cases differently, even within the European Union.. As far as Sweden is concerned, there were apparently a lot of "active cases" early in the pandemic. However, what was happening was that most places were declaring cases as "recovered" after the person's symptoms receded, which takes about 7 days. On the other hand, Sweden did not officially declare a case recovered until the person was completely virus free, which takes about 5 weeks. So, Sweden's reported number of active cases remained much higher than most other places, for a much longer time, which may have generated a lot of the negative media publicity. This situation no longer applies, because the number of cases is much lower now.

I would hate to be the person who has to officially compile the worldwide data on this pandemic. Even the decision about what constitutes a "Covid death" differs between countries, with some jurisdictions including all people who test positive for the virus, irrespective of what they die of, and others counting only those cases where the virus is the main cause of death (eg. a cytokine storm). Trying to make the worldwide data comparable will not be easy.

Quarantine in Sweden

So, what has been different about Sweden? It is simply that the national government expects Swedes to take official advice when they are given it, without being forced to do so. In most cases, this actually works, although there will always be exceptions. In the case of this pandemic, the government simply gave everyone the same advice as everyone else in the world was forced to take. It really is as simple as that.

Where I spent the first two-thirds of my life, in Australia, such an approach would be laughable. because Australians do not respect their governments, state or national. So, without a police-enforced mandatory shut-down, the virus would have spread unchecked. You may have seen the media pictures of Sydney people jammed onto beaches when they were told not to go to work (Famous Sydney beaches closed after crowds flout coronavirus restrictions); and you may have read about the complete failure in the Melbourne hotel used for quarantining international arrivals (Breaches of hotel quarantine 'let Victorians down', Minister says as inquiry launched). There is nothing unexpected about this, even if I say this as an Australian citizen.

In contrast, Sweden's island summer-holiday destinations have had among the lowest infection rates in the whole country — Öland 0.3%, Gotland 0.3%, compared to a national total of 0.8%. I am not claiming that Swedes are more sensible than anyone else (or less!), merely that they take official advice without being forced. This may seem odd to you, perhaps, but it is true, as I can attest from living here for the past one-third of my life. Swedes are quite proud of being different in this way. Indeed, to a Swede, a government-enforced lock-down would probably have worked a great deal worse than the official (advisory) approach chosen.

So, businesses were told to have their employees work from home, and those that can do so have been implementing this. The recommendation remains in force until the end of the year, notably to reduce problems with public transport. Of direct effect on me, universities all immediately instituted online classes (instead of face-to-face), and this remains in force — Uppsala University is a pretty quiet place, these days. In a similar manner, senior high schools have had their students working from home (they are on summer holidays now, of course) — secondary schools are at risk of being important sources of infection (see Contact tracing during coronavirus disease outbreak, South Korea, 2020).

On the other hand, of greatest surprise to me, it was decided to keep the junior (primary) schools operating normally. This has turned out very well, because there have been no reports of any students bringing Covid-19 home to their families. It is now accepted that young children are not usually infectious, contrary to the common belief at the beginning of the pandemic (Children are not COVID-19 super spreaders: time to go back to school). This is one thing that Sweden apparently got right, contrary to actions in most other places in the world — disrupting the lives of young people is not a good thing.

In other quarantine actions, many places will now deliver your shopping order to your car, so you don't have to enter shops; and all open locations have signs about social distancing, and 1.5-meter (5 foot) marks on the floor. All public-access places have perspex screens between the service-provider and customer, and between customers; hand-washes are freely available; and cleaning services are now more strict and frequent. Most eating places serve customers outdoors only. We have been advised not to meet in groups, except outdoors, and even then there should be fewer than 50 people. All professional sporting activities have been postponed, along with other group activities, such as garden viewings (eg. Öppen Trädgård 2020 inställt).

My local supermarket now opens one hour earlier on week-days, specifically for people in high-risk groups (such as myself) during that extra time. The accompanying sign is typically Swedish, in that it points out the purpose of opening early, and asks for co-operation from other customers, but also says that this will not be formally policed. As expected from Swedes, when my wife and I go there, almost all of the people are elderly, indicating that the others are, indeed, co-operating (or perhaps do not want to get up early).

Be realistic, would this type of voluntary approach actually work in your country? The only report of a major breach of quarantine was a party held to celebrate graduating from high school. The government recommended that these parties be avoided this year, much to the disappointment of the students, as this is always a big event. One group of c. 200 people ignored this advice, and thereby spread the virus among more than 40 people (Coronasmitta spreds på stor studentfest). All countries have idiots.


There are practical problems to all of this, of course, just like in those places with full lock-downs. A personal one for me was the loss of my non-pension income. I used to help a Swedish academic with his English, but we have not met since the arrival of the virus in Sweden. I doubt that these meetings will ever resume, post-Covid.

Also, all travel has been restricted, which resulted in the cancellation of our long-planned trip to northern Sweden and Norway. All countries in Europe officially closed their borders for a few months. Within Sweden, typically, given what I have said above, we were not actually prevented from traveling, but were instead told that if we get sick we will have to be medically treated within our home county, which dissuaded everyone from going very far.

This has all changed in the past week. The ferries to Germany are now open; and it is summer holidays. This seems to have encouraged Swedes to come out of quarantine, and get on the move. This past weekend, it has become clear that relatives are visiting each other again (they are out cycling in family groups on my country roads, for example); and I have seen more caravans and campervans on the highways than I have at any time since last summer. Apparently, the summer destinations have started filling up with tourists, so this will be the test of how far Sweden has come (Tusentals turister trängs på Gotlands gator).

As a final discussion point, I will mention that I actually live just outside of town, in a small community in the countryside. So, social distancing is not a practical problem for me, unless I go into town. In my local area, there have been 24 confirmed cases out of 3,007 people, which is an infection rate of 0.8%, which is the same rate as for Sweden as a whole.

However, this introduces the issue of the non-randomness of cases, which are quite definitely clustered (A fraction of European regions account for a majority of covid deaths). Within Sweden, for example, Stockholm, as by far the largest city, has the highest death rate, as I will discuss below. So, the risks associated with infection depend very much on where you live. Sweden may have a small population, but its area is quite large, and spatial diversity is a real factor, just as it is in larger countries.

It is therefore a pity that all decisions within the European Union regarding the pandemic are done at the national level. A pandemic requires communal action, because any individual action can threaten the safety of the group as a whole. It has apparently one of the biggest "riddles" that the Buddhist countries of South-East Asia (Cambodia, Laos, Myanmar, Thailand, Vietnam) have been almost completely untouched by the pandemic that has spread to every other part of the globe (Why has the pandemic spared the Buddhist parts of South-East Asia?); but anyone who has ever watched the co-operative way in which these communities function will not be surprised in the slightest.

It has therefore been the biggest disappointment that the European Union has been surprisingly non-united in its responses. At the moment, some countries are now open to visitors from some other countries, while residents of yet other countries are currently banned. None of this seems to be based on the actual case-rate data, but is much more to do with politics and how much money might be made during the summer holiday season. Greece, for example, is open to the British but not to Swedes, while Croatia is open to both. Needless to say, Croatia (and neighboring Montenegro) have had massive surges in cases in the past few weeks, since they are open to most holiday-makers, having had relatively few cases before — it is now no safer to be there than in much of Sweden.

[Aside: My wife and I came back from a holiday in Croatia on the same day that the main influx of the virus arrived in Sweden from northern Italy, where is was acquired by Swedes who had taken the school break week to go downhill skiing. The other large source in Scandinavia was via those people who had gone to Austria for the same purpose.]

Protecting the elderly

This brings us to the biggest point of criticism within Sweden itself. This pandemic has highlighted very strongly just how badly elderly people are treated in this country. Put simply, I would never live in an aged-care home here, even if they were paying me, rather than the other way around.

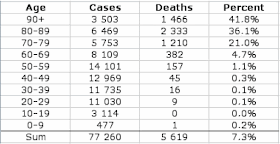
First, let's look at the current data on age-related Covid cases in Sweden (compiled by Han Yin Lap). As you can see, 7.3% of the Covid-19 cases in Sweden have resulted in death, but 89.1% of those deaths have been in the 70+ age group. This is pretty much the same as elsewhere, sadly enough.


The problem in Sweden has been that the virus got into many of the aged-care homes long before anything was officially done about it. The government did not institute mandatory virus-testing of the staff (or even recommend it); and, as we now all know, it is the asymptomatic people who are the most dangerous in terms of spread. Furthermore, all reports (anecdotal as well as official) indicate that staff operational procedures were not modified before the middle of May, to protect either the patients or the staff (being a health-care worker is always risky: How many healthcare workers have gotten coronavirus?).

You can imagine the outcome for yourself. The worst case was in Jönköping County. This is not a densely populated place by any means, but the case rate has been 1.2% of the people, compared to the national rate of 0.8%. The virus got into a large aged-care facility, of course. The highest death rates have been been in Stockholm County (0.10%) and Södermanland County (0.08%), compared to the national 0.05%, for exactly the same reason.

Closer to home, my local newspaper recently reported the data shown in the following table (Stora skillnad i hur hårt äldreboenden drabbats. Upsala Nya Tidning, Lördag 4 juli 2020, p.6). Across 979 people in 20 aged-care facilities in Uppsala County, the death rate has been 5.8%, but varied from 0% to 18%. Only two facilities have so far reported no coronavirus-related deaths.


You can see why this has been a big discussion point, as this situation is by no means unusual in the other counties, except for Västerbotten (Inte enbart en slump att Västerbotten har få döda i covid-19). Indeed, it is a national disgrace.

The issue here has been the lack of government-instituted testing. Sweden has a nationalized health-care system, and it does not work any better than such systems ever do. I once lay in a hospital ward for a day and a half, fully scrubbed and prepared for surgery, to have my appendix removed. When they finally got around to me, the knot on my surgery gown was so tight that they had to cut the cord to get the thing off (with a laugh, of course). I have other anecdotes of similar nature.

So, as far as the pandemic has been concerned, the national government dithered for months before deciding that they would, indeed, bear much of the financial cost of testing. Until then, only people with symptoms were tested for the virus. What is the point of that?!! We needed to know who had the virus and did not themselves know it, not those whom we were already sure had it.

Anyway, without national funding, the counties, who do the actual sampling, typically do nothing. This is how a national health scheme works (or does not). Fortunately, the government finally started testing more widely for the virus, which created a spike in reported cases in June, as noted in the first graph above.

Recently, the government agreed to fund testing for antibodies, for anyone who wants it. Only two counties, Uppsala and Stockholm, immediately implemented this idea, at the beginning of this month. Sadly, my wife and I have now been waiting for 3 weeks for the results of our tests. We were told: "it make take a week", which in the Swedish health-care system translates as: "don't hold you breath". We have, of course, been sent our bills, for our (smallish) part of the cost.

Conclusion

So, there you have it. Sweden has done no worse than a lot of other places, in spite of doing things somewhat differently. There was no government-enforced lock-down, but instead a government-advised voluntary quarantine. This has worked okay, and certainly much better than the government lock-down in the USA; but plenty of countries in Europe have had lower case rates. The death rate is a bit embarrassing, because old people are not treated well in Sweden. In that sense, what I am doing living in Sweden in my sixties? As Pete Townsend once noted (My Generation): "I hope I die before I get old."

Note: For a slightly later but similar commentary by another local, see: Sweden did not take herd immunity approach against coronavirus pandemic.

Monday, July 13, 2020

Tattoo Monday XX


There are a number of tattoo designs that take the concept of a Tree of Life and incorporate the concept of DNA. Here is a selection of some of them. For an earlier example, see Tattoo Monday IV.


Monday, July 6, 2020

The power of wine and spirits brands in the marketplace


Commercial alcoholic beverages have all sorts of market characteristics, one of which is their ability to dominate their markets. This feature was investigated in a survey of the world’s leading drinks brands, published annually from 2006-2015 by the international company strategists Intangible Business. This was called The Power 100, in which each brand was given a power score, allowing them to be ranked.


Intangible Business apparently researched c. 10,000 spirit and wine brands across the globe, to assess both the financial contribution of each brand and its strength in the eyes of the consumer. To do this, they combined scores from a panel of drinks industry experts with global sales data (see Methodology, and Panelists). [Note: the resulting reports used to be housed at www.drinkspowerbrands.com, but this site disappeared in 2017, with 2015 as the final report.]

The Brand Score (out of 100) was produced by the panelists, who scored each brand for these eight characteristics (scale: 0–10):
  • Share of market: a volume-based measure of market share
  • Future Growth: projected growth based on 10 years of historical data plus future trends
  • Premium Price Positioning: a measure of the brand’s ability to command a premium
  • Market Scope: number of markets in which the brand has a significant presence
  • Brand Awareness: a combination of prompted and spontaneous awareness
  • Brand Relevancy: capacity to relate to the brand and a propensity to purchase
  • Brand Heritage: the brand’s longevity and a measure of how it is embedded in local culture
  • Brand Perception: loyalty, and how close a strong brand image is to a desire for ownership.
This Score was then turned into a Total Score (out of 100) by multiplying this by the brand's weighted sales volume. It was this Total Score that was used for the final Power list, with the top 100 being listed each year. However, I am not interested in this here — the Total Score is dominated by the sales volume, not by the Brand Score. The latter seems more interesting, so I will look at it here.

Across the 10 years, 141 brands appeared at least once, although only 68 (48%) of them appeared in all 10 surveys, with another 8 appearing in 9/10 years. That is, only half of the brands had any sustained Power. In the other cases, the brands either appeared in the early surveys only, or in the later surveys only — very few came and went from year to year (implying that they were just on the border of the top 100).

Network of the Brand Scores for 2015

As usual in this blog, we can get a picture of the variation among brands by using a phylogenetic network, as a form of exploratory data analysis. For the first analysis, I calculated the similarity across the 8 Brand Score criteria using the Manhattan distance, based on those 100 brands that appeared in the final (2015) report. A Neighbor-net analysis was then used to display the between-year similarities, as shown in the graph above. Brands that are closely connected in the network are similar to each other based on their Brand Score, and those that are further apart are progressively more different from each other.

There is a general trend of high scores at the top of the network downwards to the bottom left. However, the network does not show a simple trend, such as is implied by the 1-dimensional ranking produced in the original Intangible Business report. That is, there is a complexity among the scores — it is possible for two brands to get the same Brand Score but to get it by scoring highly on quite different criteria. This illustrates the importance of using multi-dimensional summaries for exploratory data analysis — the patterns to be found may not be simple.

In this particular case, note that some brands, like Crown Royal and Dom Perignon, diverge greatly from the overall trend, indicating that they have unusual combinations of scores. Also, the two neighborhoods at the left and right of the network have different combinations from each other, although they end up with similar overall Brand Scores.

Network of the average Brand Scores across the 10 years

For the second analysis, I compared the different years. I calculated the Brand Score similarity across the 10 years using the Manhattan distance, based only on those 104 brands that appeared in at least 5 of the years. A Neighbor-net analysis was then used to display the between-year similarities, as shown in the second graph.

As you can see, in this case the network is as linear as you could expect, indicating that there is little more than 1 dimension of information to summarize. In this case, it basically shows a single rank-ordering of the Brand Scores averaged across the years (with the highest average score at the top of the network and the lowest at the bottom). So, in this case it is much simpler just to list the average Brand Scores in a table, rather than use the network (keep it simple!) — the network is being used to check whether there are more complex patterns, but not to display the pattern found.

This table is shown next, because it has never been listed before (none of the original reports compare all of the years). You can find your favorite brand, and check how "powerful" it has been in the maketplace, across time. Spirits do better than wines, but there is no consistency about which types of spirits do best.

Brand
Johnnie Walker
Bacardi
Hennessy
Jack Daniel's
Moët et Chandon
Smirnoff Vodka
Absolut
Dom Pérignon
Baileys
Veuve Clicquot
Chivas Regal
Captain Morgan
Cuervo
Martini Vermouth
Jameson
The Macallan
Ballantine's
Havana Club
Rémy Martin
Jägermeister
Maker's Mark
Glenfiddich
Martell
Jim Beam
Grey Goose
Bombay Sapphire
The Glenlivet
Concha y Toro
Robert Mondavi
Stolichnaya
Beefeater
Gordon's Gin
Courvoisier
Malibu
Tanqueray
Sauza
Crown Royal
Taittinger
Mumm
J & B
Patrón
Penfolds
Hardys
Cointreau
Freixenet
Gallo
Wolf Blass
Southern Comfort
Jacobs Creek
Campari Bitters
Famous Grouse
Torres
Grand Marnier
Canadian Club
Finlandia
Piper Heidsieck
Laurent Perrier
Beringer
Dewars
Kahlua
Martini Sparkling Wine
Yellowtail
Lindeman's
Svedka
Skyy
Wild Turkey
Grant's Scotch
Teacher's
Ketel One
De Kuyper
Kendall Jackson
Nicolas Feuillatte
Cutty Sark
Aperol
Disaronno
Ricard
Cinzano Vermouth
Russian Standard
Fernet-Branca
Bell's
Blossom Hill
Sutter Home
William Lawson's
Wyborowa
El Jimador
Bols Liqueurs
Eristoff
Clan Campbell
Seagram's 7 Crown
100 Pipers
Seagram Gin
Ramazzotti Amaro
Inglenook
Black Velvet
Three Olives
Seagram V.O.
Cacique
Metaxa
E & J Brandy
Canadian Mist
Dreher
Masson Grande Amber Brandy
Pastis 51
Moskowskaya
Category
Blended Scotch
Rum / Cane
Cognac
US Whiskey
Champagne
Vodka
Vodka
Champagne
Liqueurs
Champagne
Blended Scotch
Rum / Cane
Tequila
Light Aperitif
Blended Irish Whiskey
Malt Scotch
Blended Scotch
Rum / Cane
Cognac
Bitters / Spirit Aperitifs
US Whiskey
Malt Scotch
Cognac
US Whiskey
Vodka
Gin / Genever
Malt Scotch
Still Light Wine
Still Light Wine
Vodka
Gin / Genever
Gin / Genever
Cognac
Liqueurs
Gin / Genever
Tequila
Canadian Whisky
Champagne
Champagne
Blended Scotch
Tequila
Still Light Wine
Still Light Wine
Liqueurs
Other Sparkling
Still Light Wine
Still Light Wine
Liqueurs
Still Light Wine
Bitters / Spirit Aperitifs
Blended Scotch
Still Light Wine
Liqueurs
Canadian Whisky
Vodka
Champagne
Champagne
Still Light Wine
Blended Scotch
Liqueurs
Other Sparkling
Still Light Wine
Still Light Wine
Vodka
Vodka
US Whiskey
Blended Scotch
Blended Scotch
Vodka
Liqueurs
Still Light Wine
Champagne
Blended Scotch
Light Aperitif
Liqueurs
Aniseed
Light Aperitif
Vodka
Bitters / Spirit Aperitifs
Blended Scotch
Still Light Wine
Still Light Wine
Blended Scotch
Vodka
Tequila
Liqueurs
Georgian Vodka
Blended Scotch
US Whiskey
Blended Scotch
Gin / Genever
Bitters / Spirit Aperitifs
Still Light Wine
Canadian Whisky
Vodka
Canadian Whisky
Rum / Cane
Other Brandy
Other Brandy
Canadian Whisky
Other Brandy
Other Brandy
Aniseed
Vodka
Brand Score
81.0
76.9
76.9
76.8
74.2
73.6
70.8
69.7
69.3
69.3
69.1
67.4
67.1
66.3
65.7
63.4
63.4
63.3
63.2
62.8
62.0
62.0
61.9
61.6
61.6
60.9
60.8
60.7
60.4
60.2
59.7
58.7
58.7
57.8
57.7
57.7
57.1
57.0
57.0
56.9
56.9
56.4
56.1
55.9
55.7
55.6
55.4
55.3
55.0
54.7
54.7
54.5
54.5
54.0
53.9
53.2
52.9
52.6
52.5
52.2
52.2
52.1
52.0
51.9
51.8
51.8
51.5
51.1
51.0
50.4
50.0
49.2
49.1
49.0
49.0
49.0
48.8
48.7
48.4
48.0
47.6
47.1
46.4
45.8
45.1
45.0
44.1
43.7
43.1
42.4
42.3
42.3
42.2
42.0
41.9
41.0
40.6
39.6
39.5
39.3
39.3
37.7
37.6
37.0